Note : This is only a chart analysis and for study purposes. Not a recommendation to buy or sell.
Chart Analysis Summary:
Breakout Zone:
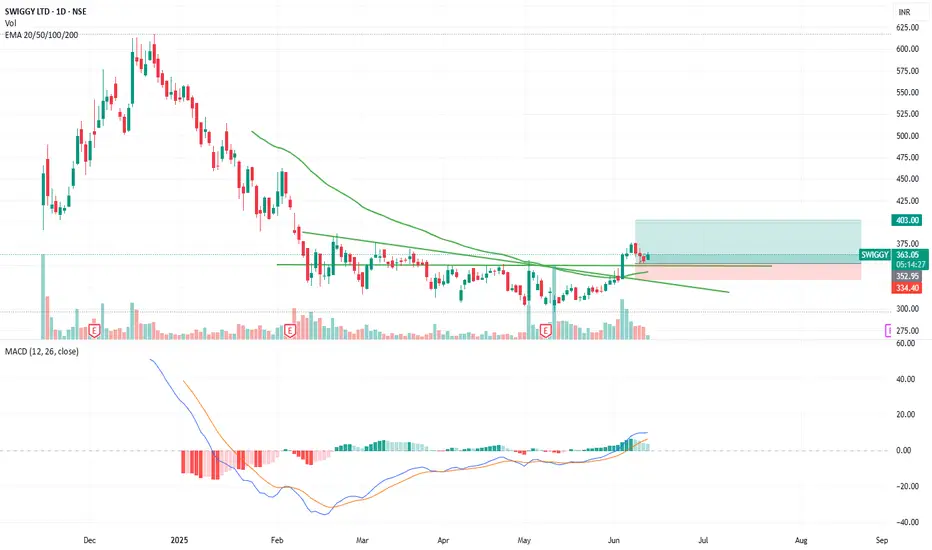
The stock has clearly broken above a descending trendline that acted as resistance for several months. The breakout was supported by a strong bullish candle with notable volume, indicating genuine buying interest.
Volume:
The breakout candle shows a volume spike, validating the move. Volume continues to remain stable post-breakout, supporting the sustainability of the trend.
Retest Confirmation:
After the breakout, SWIGGY came back to retest the breakout zone (~345-350) and formed a bullish reversal, confirming the support zone.
Current Price Action:
Price is now moving higher again, suggesting the end of the retest phase and a potential beginning of a fresh uptrend.
EMA Analysis:
Price is trading above the 20/50/100/200 EMA cluster (currently near 339.25), which was earlier acting as a dynamic resistance and now may serve as support.
MACD:
MACD crossover above the signal line is visible and trending upward – a bullish momentum signal.
Chart Analysis Summary:
Breakout Zone:
The stock has clearly broken above a descending trendline that acted as resistance for several months. The breakout was supported by a strong bullish candle with notable volume, indicating genuine buying interest.
Volume:
The breakout candle shows a volume spike, validating the move. Volume continues to remain stable post-breakout, supporting the sustainability of the trend.
Retest Confirmation:
After the breakout, SWIGGY came back to retest the breakout zone (~345-350) and formed a bullish reversal, confirming the support zone.
Current Price Action:
Price is now moving higher again, suggesting the end of the retest phase and a potential beginning of a fresh uptrend.
EMA Analysis:
Price is trading above the 20/50/100/200 EMA cluster (currently near 339.25), which was earlier acting as a dynamic resistance and now may serve as support.
MACD:
MACD crossover above the signal line is visible and trending upward – a bullish momentum signal.
Penerbitan berkaitan
Penafian
Maklumat dan penerbitan adalah tidak bertujuan, dan tidak membentuk, nasihat atau cadangan kewangan, pelaburan, dagangan atau jenis lain yang diberikan atau disahkan oleh TradingView. Baca lebih dalam Terma Penggunaan.
Penerbitan berkaitan
Penafian
Maklumat dan penerbitan adalah tidak bertujuan, dan tidak membentuk, nasihat atau cadangan kewangan, pelaburan, dagangan atau jenis lain yang diberikan atau disahkan oleh TradingView. Baca lebih dalam Terma Penggunaan.