Chart Analysis (Study Purpose Only):
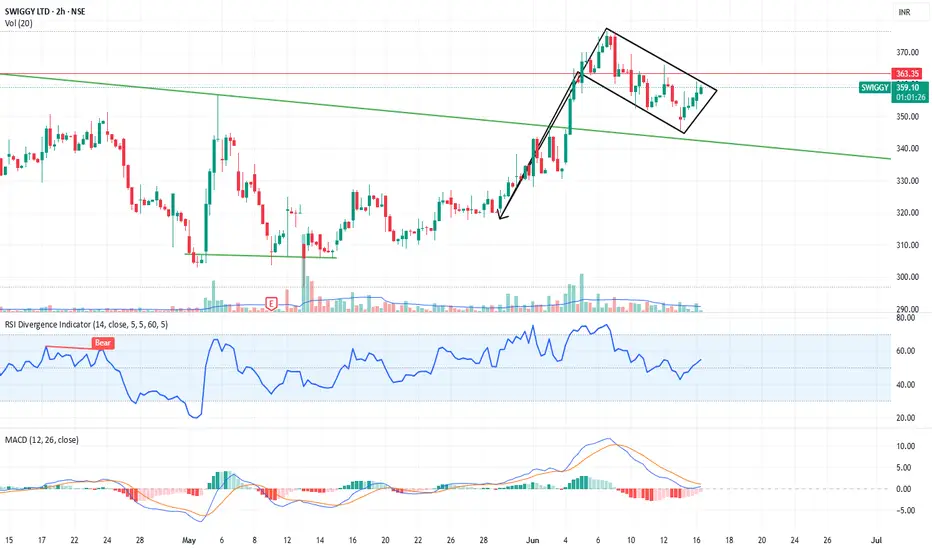
Pattern Observed: After a sharp uptrend, the stock has formed a falling channel (bullish flag) — which typically signals a continuation of the trend.
Support/Resistance:
The price is consolidating above a long-term trendline resistance, which is now acting as support.
Resistance zone is near ₹365–₹367, and support is around the ₹340–₹345 range.
Indicators:
RSI is currently at ~60, suggesting mild bullish momentum without being overbought.
MACD is in a bearish crossover but appears to be flattening, possibly preparing for a bullish crossover.
Volume: Declining volume during the pullback suggests weak selling pressure, often a bullish sign in continuation patterns.
🟢 A breakout above the upper channel with volume could confirm a bullish continuation.
Penerbitan berkaitan
Penafian
Maklumat dan penerbitan adalah tidak dimaksudkan untuk menjadi, dan tidak membentuk, nasihat untuk kewangan, pelaburan, perdagangan dan jenis-jenis lain atau cadangan yang dibekalkan atau disahkan oleh TradingView. Baca dengan lebih lanjut di Terma Penggunaan.
Penerbitan berkaitan
Penafian
Maklumat dan penerbitan adalah tidak dimaksudkan untuk menjadi, dan tidak membentuk, nasihat untuk kewangan, pelaburan, perdagangan dan jenis-jenis lain atau cadangan yang dibekalkan atau disahkan oleh TradingView. Baca dengan lebih lanjut di Terma Penggunaan.