📈 1-Hour Time Frame Technical Overview
Based on recent intraday data, here’s a snapshot of SYRMA’s 1-hour technical indicators:
Relative Strength Index (RSI): 67.55, indicating bullish momentum.
Moving Average Convergence Divergence (MACD): 26.80, suggesting upward momentum.
Average Directional Index (ADX): 25.47, reflecting a moderately strong trend.
Stochastic Oscillator: 56.86, showing no overbought or oversold conditions.
Supertrend: ₹765.70, indicating a bullish trend.
Parabolic SAR (PSAR): ₹792.41, supporting the bullish trend.
Chaikin Money Flow (CMF): 0.110, suggesting accumulation of shares.
These indicators collectively point towards a bullish short-term trend for SYRMA.
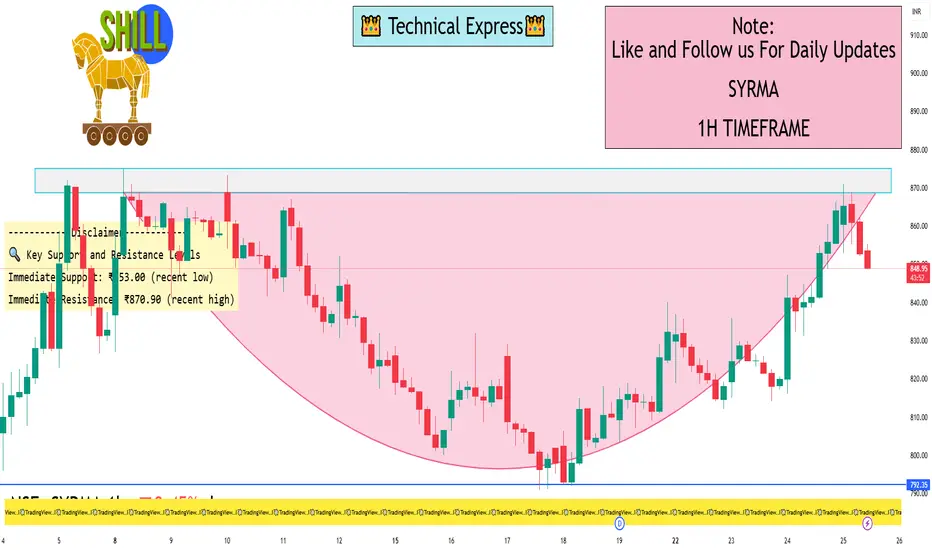
🔍 Key Support and Resistance Levels
Immediate Support: ₹853.00 (recent low)
Immediate Resistance: ₹870.90 (recent high)
A breakout above ₹870.90 could signal further upside potential, while a dip below ₹853.00 might suggest a pullback.
For real-time intraday analysis on a 1-hour time frame, you can utilize the following platforms:
TradingView: Offers a comprehensive technical analysis overview, including indicators like RSI, MACD, and moving averages
Chartink: Provides customizable candlestick charts with various time frames and technical indicators
Investing.com: Features candlestick charts with pattern recognition and technical indicators
TopStockResearch: Delivers interactive charts with real-time updates and technical analysis tools
Based on recent intraday data, here’s a snapshot of SYRMA’s 1-hour technical indicators:
Relative Strength Index (RSI): 67.55, indicating bullish momentum.
Moving Average Convergence Divergence (MACD): 26.80, suggesting upward momentum.
Average Directional Index (ADX): 25.47, reflecting a moderately strong trend.
Stochastic Oscillator: 56.86, showing no overbought or oversold conditions.
Supertrend: ₹765.70, indicating a bullish trend.
Parabolic SAR (PSAR): ₹792.41, supporting the bullish trend.
Chaikin Money Flow (CMF): 0.110, suggesting accumulation of shares.
These indicators collectively point towards a bullish short-term trend for SYRMA.
🔍 Key Support and Resistance Levels
Immediate Support: ₹853.00 (recent low)
Immediate Resistance: ₹870.90 (recent high)
A breakout above ₹870.90 could signal further upside potential, while a dip below ₹853.00 might suggest a pullback.
For real-time intraday analysis on a 1-hour time frame, you can utilize the following platforms:
TradingView: Offers a comprehensive technical analysis overview, including indicators like RSI, MACD, and moving averages
Chartink: Provides customizable candlestick charts with various time frames and technical indicators
Investing.com: Features candlestick charts with pattern recognition and technical indicators
TopStockResearch: Delivers interactive charts with real-time updates and technical analysis tools
I built a Buy & Sell Signal Indicator with 85% accuracy.
📈 Get access via DM or
WhatsApp: wa.link/d997q0
Contact - +91 76782 40962
| Email: techncialexpress@gmail.com
| Script Coder | Trader | Investor | From India
📈 Get access via DM or
WhatsApp: wa.link/d997q0
Contact - +91 76782 40962
| Email: techncialexpress@gmail.com
| Script Coder | Trader | Investor | From India
Penerbitan berkaitan
Penafian
Maklumat dan penerbitan adalah tidak bertujuan, dan tidak membentuk, nasihat atau cadangan kewangan, pelaburan, dagangan atau jenis lain yang diberikan atau disahkan oleh TradingView. Baca lebih dalam Terma Penggunaan.