🔎 Market Overview
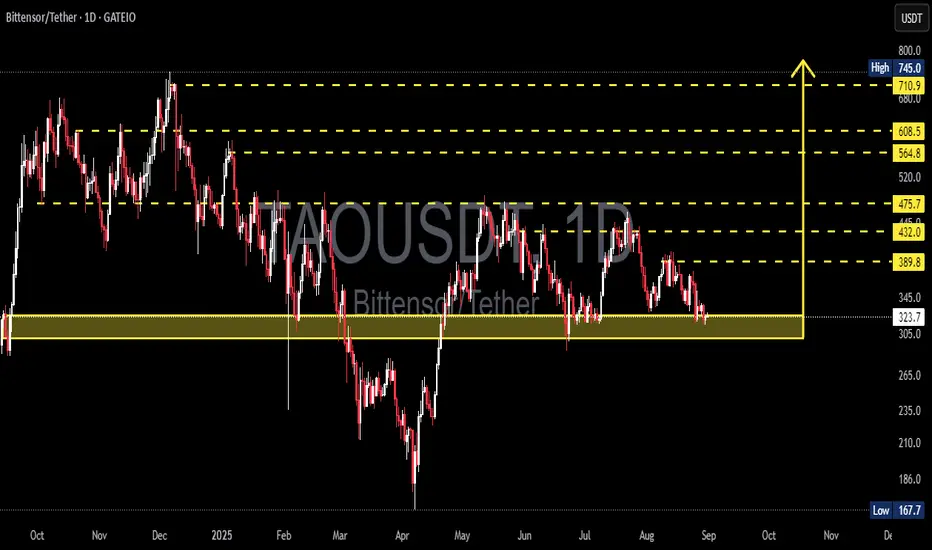
TAO/USDT is currently trading around 324 USDT, sitting right inside the key demand zone (305–345) that has been tested multiple times since late 2024. This area has repeatedly acted as a strong defensive wall for buyers, and once again the market is waiting for a big decision: bounce or breakdown.
From April to August 2025, the chart shows a series of lower highs, reflecting continued selling pressure. However, the repeated defense of this demand zone suggests accumulation is possible if a strong bullish reaction appears.
---
🧩 Price Structure & Pattern
Current pattern: Consolidation within the demand zone (305–345).
Key characteristics:
Buyers have successfully defended this level multiple times → potential accumulation area.
Larger structure still shows minor downtrend (lower highs).
A confirmed breakdown could trigger deeper sell-offs.
In short, this is the battle zone between bulls and bears that will determine the medium-term direction.
---
📈 Bullish Scenario
If price holds and bounces from the demand zone:
Confirmation: Daily bullish candle closing above 345–350 with strong volume.
Upside targets:
🎯 TP1: 389.8 (first resistance & short-term supply zone)
🎯 TP2: 432.0 (mid-term supply zone)
🎯 TP3: 475.7 (major resistance – key to shift medium-term trend)
🎯 Extensions: 564.8 – 608.5 – 710.9 – 745.0
➡️ A successful bounce could form a double bottom / base formation.
---
📉 Bearish Scenario
If price fails to hold the demand zone (daily close below 305):
Confirmation: Breakdown candle with strong volume + failed retest.
Downside targets:
🎯 265 – 235 (nearest supports)
🎯 167.7 (historical low – potential final target if strong selling pressure continues)
➡️ This would form a major support breakdown, potentially triggering a larger distribution phase.
---
⚖️ Technical Conclusion
Current bias: Neutral to Bearish – downtrend structure remains, but bulls are still defending.
305–345 is the make-or-break zone.
Bounce → potential rally towards 389–475.
Breakdown → possible drop to 235 or even 167.
---
🛡️ Risk Management Notes
Clear stop-loss levels:
Bullish setup: SL below 305.
Bearish setup: SL above 345–350 after breakdown.
Scale into positions rather than going all-in.
Watch for volume confirmation & momentum indicators (RSI/MACD) to avoid false breakouts.
---
📌 Extra Insights
The 305–345 zone is not only a technical level but also a psychological price floor, tested multiple times.
The structure of lower highs vs. strong support often resolves with a major breakout — meaning the next move could be very aggressive.
Patience is key: traders should wait for a clear daily close confirmation before entering to avoid being trapped in a fake move.
#TAO #Bittensor #TAOUSDT #CryptoAnalysis #TechnicalAnalysis #SupportResistance #Breakout #CryptoTrading #SwingTrading #PriceAction
✅ Get Free Signals! Join Our Telegram Channel Here: t.me/TheCryptoNuclear
✅ Twitter: twitter.com/crypto_nuclear
✅ Join Bybit : partner.bybit.com/b/nuclearvip
✅ Benefits : Lifetime Trading Fee Discount -50%
✅ Twitter: twitter.com/crypto_nuclear
✅ Join Bybit : partner.bybit.com/b/nuclearvip
✅ Benefits : Lifetime Trading Fee Discount -50%
Penafian
Maklumat dan penerbitan adalah tidak dimaksudkan untuk menjadi, dan tidak membentuk, nasihat untuk kewangan, pelaburan, perdagangan dan jenis-jenis lain atau cadangan yang dibekalkan atau disahkan oleh TradingView. Baca dengan lebih lanjut di Terma Penggunaan.