TATA POWER – Reversal Setup Near Key Support | Cup & Handle Retest
For Study Purpose Only
🕒 Timeframe: Weekly & Daily
💡 Pattern: Cup & Handle (trendline retest + neckline breakout)
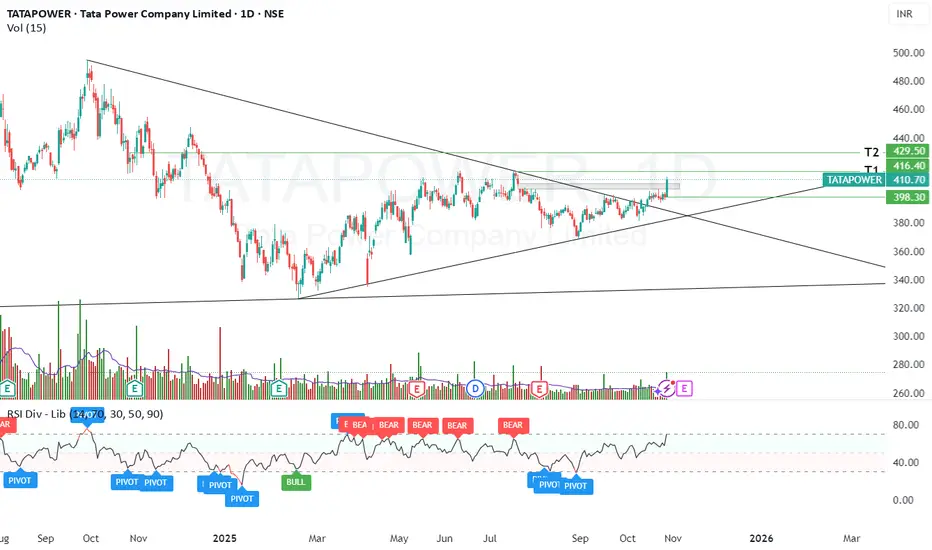
📈 Current Zone: ₹400–₹410
🎯 Targets: ₹418 / ₹430
⏳ Duration: 10–15 Days
🧭 Technical View:
On the weekly chart, Tata Power has taken support along the previous cup-and-handle trendline, right near the lower boundary of the handle, and has reversed upward from this level — suggesting a continuation of the larger bullish structure.
On the daily chart, the stock has delivered a clean neckline breakout while also filling the earlier runaway gap in the ₹400–₹410 zone. This gap fill acts as a successful retest of support and builds a foundation for the next leg up.
The price has shown healthy consolidation just below ₹400, forming a base with stable volume. A sustained close above ₹400 could trigger a short-term reversal move toward ₹418 and ₹430 levels in the coming sessions.
📊 Study Highlights:
Weekly support confirmation at previous trendline
Neckline breakout with retest on daily chart
Gap fill adds confidence to structural strength
Consolidation phase ending near ₹400
Momentum recovery visible on short-term indicators
⚠️ Disclaimer:
This analysis is purely for educational and study purposes. Not a buy/sell recommendation. Always conduct your own due diligence.
For Study Purpose Only
🕒 Timeframe: Weekly & Daily
💡 Pattern: Cup & Handle (trendline retest + neckline breakout)
📈 Current Zone: ₹400–₹410
🎯 Targets: ₹418 / ₹430
⏳ Duration: 10–15 Days
🧭 Technical View:
On the weekly chart, Tata Power has taken support along the previous cup-and-handle trendline, right near the lower boundary of the handle, and has reversed upward from this level — suggesting a continuation of the larger bullish structure.
On the daily chart, the stock has delivered a clean neckline breakout while also filling the earlier runaway gap in the ₹400–₹410 zone. This gap fill acts as a successful retest of support and builds a foundation for the next leg up.
The price has shown healthy consolidation just below ₹400, forming a base with stable volume. A sustained close above ₹400 could trigger a short-term reversal move toward ₹418 and ₹430 levels in the coming sessions.
📊 Study Highlights:
Weekly support confirmation at previous trendline
Neckline breakout with retest on daily chart
Gap fill adds confidence to structural strength
Consolidation phase ending near ₹400
Momentum recovery visible on short-term indicators
⚠️ Disclaimer:
This analysis is purely for educational and study purposes. Not a buy/sell recommendation. Always conduct your own due diligence.
Penafian
Maklumat dan penerbitan adalah tidak dimaksudkan untuk menjadi, dan tidak membentuk, nasihat untuk kewangan, pelaburan, perdagangan dan jenis-jenis lain atau cadangan yang dibekalkan atau disahkan oleh TradingView. Baca dengan lebih lanjut di Terma Penggunaan.
Penafian
Maklumat dan penerbitan adalah tidak dimaksudkan untuk menjadi, dan tidak membentuk, nasihat untuk kewangan, pelaburan, perdagangan dan jenis-jenis lain atau cadangan yang dibekalkan atau disahkan oleh TradingView. Baca dengan lebih lanjut di Terma Penggunaan.