Tatva Chintan – Major Trendline #Breakout After Long Downtrend 📈🔥
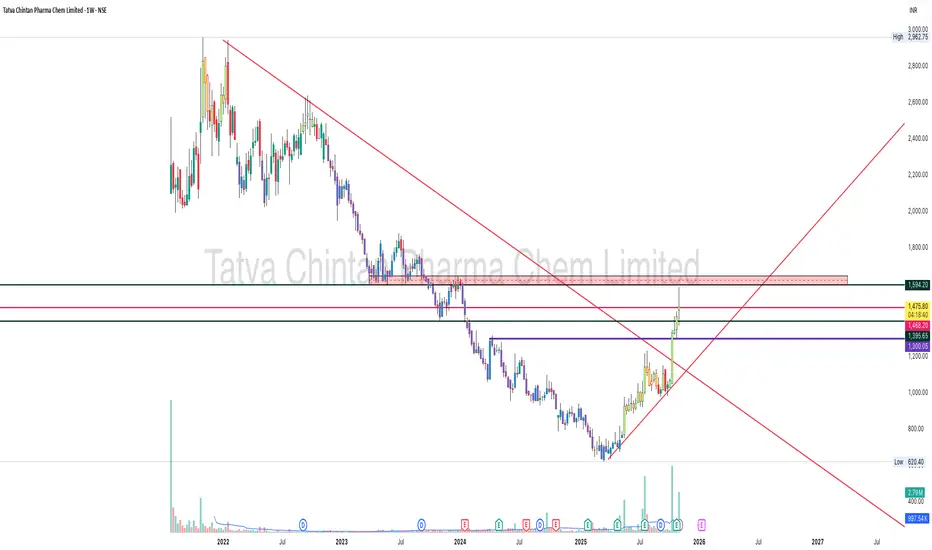
Tatva Chintan Pharma has broken a multi-year falling trendline, ending a prolonged downtrend phase since 2021.
This breakout is backed by strong price momentum + volume expansion, indicating accumulation and potential reversal into a long-term uptrend.
📌 Breakout Zone: ~₹1350 – ₹1400
📌 Current Price: ~₹1467
📌 Structure: Breakout + retest + continuation
📌 Momentum: Trading above 50 & 200 EMA on weekly 👌
Key Levels
Immediate Resistance:
Support Zones
As long as price sustains above ₹1310-1340 range, bullish structure remains intact ✅
Why This Breakout Matters
✅ Multi-year trendline breach
✅ Higher-lows forming since 2024 bottom
✅ Strong accumulation volume
✅ Pharma sector strength visible
✅ Potential trend reversal from long accumulation base
This kind of pattern often leads to multi-month swing opportunities if trend sustains.
View
Bias remains bullish until structure breaks.
Watching for follow-through above ₹1500 zone for extended upside.
📒 Educational chart analysis — not investment advice.
Tatva Chintan Pharma has broken a multi-year falling trendline, ending a prolonged downtrend phase since 2021.
This breakout is backed by strong price momentum + volume expansion, indicating accumulation and potential reversal into a long-term uptrend.
📌 Breakout Zone: ~₹1350 – ₹1400
📌 Current Price: ~₹1467
📌 Structure: Breakout + retest + continuation
📌 Momentum: Trading above 50 & 200 EMA on weekly 👌
Key Levels
Immediate Resistance:
- ₹1468 (current zone)
- ₹1594
Support Zones
- ₹1395
- ₹1343
- ₹1311 (major retest zone)
As long as price sustains above ₹1310-1340 range, bullish structure remains intact ✅
Why This Breakout Matters
✅ Multi-year trendline breach
✅ Higher-lows forming since 2024 bottom
✅ Strong accumulation volume
✅ Pharma sector strength visible
✅ Potential trend reversal from long accumulation base
This kind of pattern often leads to multi-month swing opportunities if trend sustains.
View
Bias remains bullish until structure breaks.
Watching for follow-through above ₹1500 zone for extended upside.
📒 Educational chart analysis — not investment advice.
Penafian
Maklumat dan penerbitan adalah tidak dimaksudkan untuk menjadi, dan tidak membentuk, nasihat untuk kewangan, pelaburan, perdagangan dan jenis-jenis lain atau cadangan yang dibekalkan atau disahkan oleh TradingView. Baca dengan lebih lanjut di Terma Penggunaan.
Penafian
Maklumat dan penerbitan adalah tidak dimaksudkan untuk menjadi, dan tidak membentuk, nasihat untuk kewangan, pelaburan, perdagangan dan jenis-jenis lain atau cadangan yang dibekalkan atau disahkan oleh TradingView. Baca dengan lebih lanjut di Terma Penggunaan.