TCS Eyes Recovery After Holding Strong at Key Support Levels
Topic Statement:
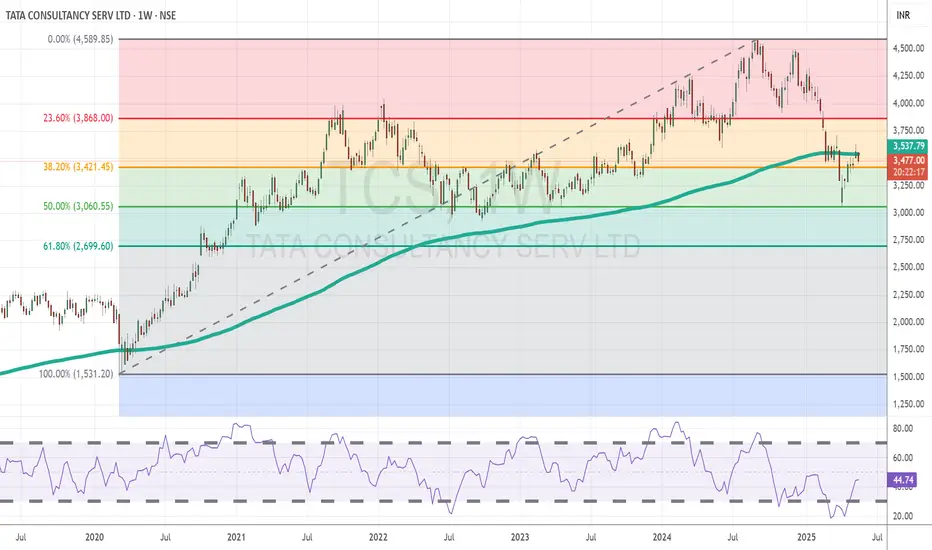
TCS has shown signs of recovery after a recent correction, with strong technical support levels reinforcing bullish potential.
Key Points:
The price previously found strong and consistent support near the ₹3000 mark, reaffirmed during the recent market correction.
A full retracement to the 50% Fibonacci level** at ₹3060 attracted significant buying interest, highlighting renewed strength.
Currently, the stock trades just below the 200-day EMA, indicating it remains in oversold territory, but with potential for reversal if momentum continues.
Penafian
Maklumat dan penerbitan adalah tidak bertujuan, dan tidak membentuk, nasihat atau cadangan kewangan, pelaburan, dagangan atau jenis lain yang diberikan atau disahkan oleh TradingView. Baca lebih dalam Terma Penggunaan.
Penafian
Maklumat dan penerbitan adalah tidak bertujuan, dan tidak membentuk, nasihat atau cadangan kewangan, pelaburan, dagangan atau jenis lain yang diberikan atau disahkan oleh TradingView. Baca lebih dalam Terma Penggunaan.