## TDPOWERSYS Price Details (as of August 8, 2025)
### Market Metrics
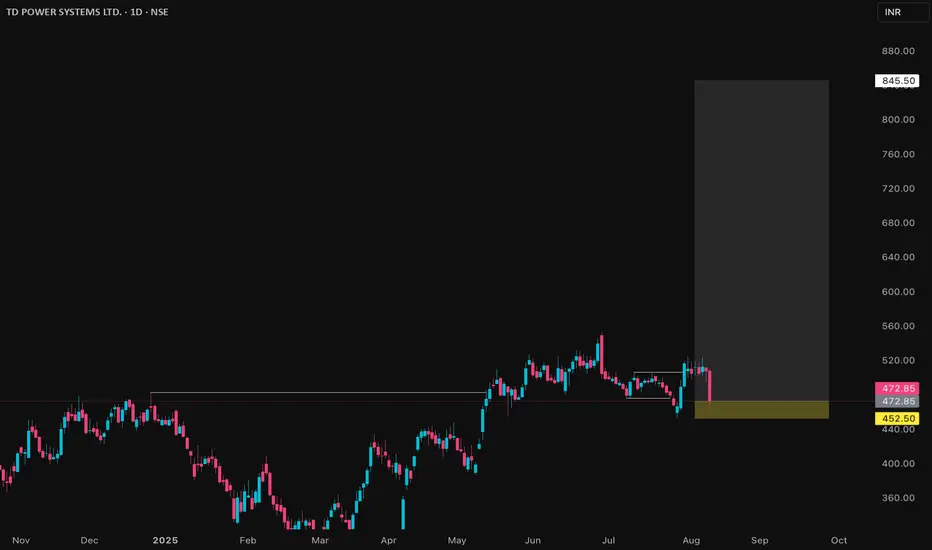
- Current share price is ₹472.85.
- Market capitalization is ₹7,385crore.
- The 52-week price range is ₹293 to ₹552.75.
- Its all-time low was ₹14 in March 2020; all-time high is ₹552.75 in June 2025.
### Returns & Volatility
- 1-month return: -1.48%.
- 1-year return: about 18%-20%.
- 3-year return: over 300%.
- 5-year return: over 1,900%.
- Weekly volatility is 6%, which is above average.
- Beta is 2.04, indicating higher risk and volatility versus the overall market.
### Valuation
- Price/Earnings Ratio: 42.31, higher than sector average.
- Price/Book Ratio: 8.58, above sector average.
- Dividend yield is 0.25%.
### Company Fundamentals
- Trailing 12-month revenue: ₹13.77billion.
- Net Profit Margin: 13.75%.
- EPS: ₹12.12.
- Gross margin: 34.13%.
- Debt to equity: 1.4%, showing low leverage.
### Valuation Analysis
- Estimated intrinsic value is ₹258.02.
- Current price is about 45% over this value, meaning the stock is overvalued.
### Qualitative Notes
- Strong profitability and cash flow, but price reflects high growth expectations.
- High volatility, especially in the short term.
- Dividend policy: small but regular.
- Recent technical signals showed buy recommendations, but the stock has been correcting lately.
**Overall:** The stock is highly priced relative to its value and historical norms, with impressive growth but also increased volatility and a potential for continued price correction.
### Market Metrics
- Current share price is ₹472.85.
- Market capitalization is ₹7,385crore.
- The 52-week price range is ₹293 to ₹552.75.
- Its all-time low was ₹14 in March 2020; all-time high is ₹552.75 in June 2025.
### Returns & Volatility
- 1-month return: -1.48%.
- 1-year return: about 18%-20%.
- 3-year return: over 300%.
- 5-year return: over 1,900%.
- Weekly volatility is 6%, which is above average.
- Beta is 2.04, indicating higher risk and volatility versus the overall market.
### Valuation
- Price/Earnings Ratio: 42.31, higher than sector average.
- Price/Book Ratio: 8.58, above sector average.
- Dividend yield is 0.25%.
### Company Fundamentals
- Trailing 12-month revenue: ₹13.77billion.
- Net Profit Margin: 13.75%.
- EPS: ₹12.12.
- Gross margin: 34.13%.
- Debt to equity: 1.4%, showing low leverage.
### Valuation Analysis
- Estimated intrinsic value is ₹258.02.
- Current price is about 45% over this value, meaning the stock is overvalued.
### Qualitative Notes
- Strong profitability and cash flow, but price reflects high growth expectations.
- High volatility, especially in the short term.
- Dividend policy: small but regular.
- Recent technical signals showed buy recommendations, but the stock has been correcting lately.
**Overall:** The stock is highly priced relative to its value and historical norms, with impressive growth but also increased volatility and a potential for continued price correction.
Dagangan aktif
16% + Move in less then 25 days almost 3 years fd gainsPenafian
Maklumat dan penerbitan adalah tidak dimaksudkan untuk menjadi, dan tidak membentuk, nasihat untuk kewangan, pelaburan, perdagangan dan jenis-jenis lain atau cadangan yang dibekalkan atau disahkan oleh TradingView. Baca dengan lebih lanjut di Terma Penggunaan.
Penafian
Maklumat dan penerbitan adalah tidak dimaksudkan untuk menjadi, dan tidak membentuk, nasihat untuk kewangan, pelaburan, perdagangan dan jenis-jenis lain atau cadangan yang dibekalkan atau disahkan oleh TradingView. Baca dengan lebih lanjut di Terma Penggunaan.