📊 Step 1: Price Action Analysis
Stock Summary:
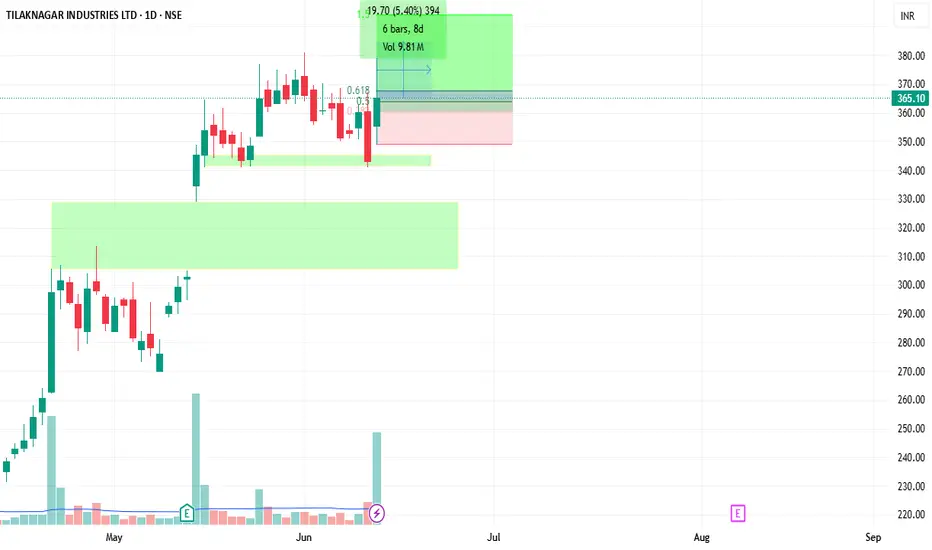
Price surged from around ₹270 in April 2025 to a high of ₹380 in May 2025.
After consolidation and a pullback, it tested the ₹340–345 zone and showed a strong bounce on June 12th.
The chart now shows a breakout candle with strong volume, closing at ₹365.10.
Support Zones:
Primary support: ₹340–345 (recent retest area)
Major demand zone: ₹310–325 (highlighted in green)
Resistance:
Immediate: ₹380 (previous swing high)
🔍 Step 2: Volume & Strength
Volume Spike: The breakout candle has one of the highest volumes in recent weeks — a very bullish confirmation.
Structure: Price formed a base just above support and broke out after testing it multiple times — indicating smart money accumulation.
📈 Stage Identification
✅ Current Stage: Stage 2 – Markup Phase (Early to Mid)
Evidence:
Clear higher low formation at ₹340 zone
Volume-led breakout from consolidation = Stage 2 continuation
No signs of distribution or topping; momentum resuming after correction
🎯 Trade Setup Insights
Metric Value
✅ Entry Area ₹355–365 (ongoing breakout)
📉 Stop-loss Below ₹340 (last swing low)
🎯 Short-Term Target ₹380–390
🧭 Medium-Term Target ₹410–430 if ₹380 breaks out
📊 Volume Support Yes – Breakout on high volume
📌 Conclusion:
This is a very bullish setup.
Current breakout suggests strong continuation in Stage 2.
Safe to enter or add on retracement toward ₹355–360 if missed the breakout.
Ideal for swing or positional trades.
Stock Summary:
Price surged from around ₹270 in April 2025 to a high of ₹380 in May 2025.
After consolidation and a pullback, it tested the ₹340–345 zone and showed a strong bounce on June 12th.
The chart now shows a breakout candle with strong volume, closing at ₹365.10.
Support Zones:
Primary support: ₹340–345 (recent retest area)
Major demand zone: ₹310–325 (highlighted in green)
Resistance:
Immediate: ₹380 (previous swing high)
🔍 Step 2: Volume & Strength
Volume Spike: The breakout candle has one of the highest volumes in recent weeks — a very bullish confirmation.
Structure: Price formed a base just above support and broke out after testing it multiple times — indicating smart money accumulation.
📈 Stage Identification
✅ Current Stage: Stage 2 – Markup Phase (Early to Mid)
Evidence:
Clear higher low formation at ₹340 zone
Volume-led breakout from consolidation = Stage 2 continuation
No signs of distribution or topping; momentum resuming after correction
🎯 Trade Setup Insights
Metric Value
✅ Entry Area ₹355–365 (ongoing breakout)
📉 Stop-loss Below ₹340 (last swing low)
🎯 Short-Term Target ₹380–390
🧭 Medium-Term Target ₹410–430 if ₹380 breaks out
📊 Volume Support Yes – Breakout on high volume
📌 Conclusion:
This is a very bullish setup.
Current breakout suggests strong continuation in Stage 2.
Safe to enter or add on retracement toward ₹355–360 if missed the breakout.
Ideal for swing or positional trades.
Penerbitan berkaitan
Penafian
Maklumat dan penerbitan adalah tidak dimaksudkan untuk menjadi, dan tidak membentuk, nasihat untuk kewangan, pelaburan, perdagangan dan jenis-jenis lain atau cadangan yang dibekalkan atau disahkan oleh TradingView. Baca dengan lebih lanjut di Terma Penggunaan.
Penerbitan berkaitan
Penafian
Maklumat dan penerbitan adalah tidak dimaksudkan untuk menjadi, dan tidak membentuk, nasihat untuk kewangan, pelaburan, perdagangan dan jenis-jenis lain atau cadangan yang dibekalkan atau disahkan oleh TradingView. Baca dengan lebih lanjut di Terma Penggunaan.