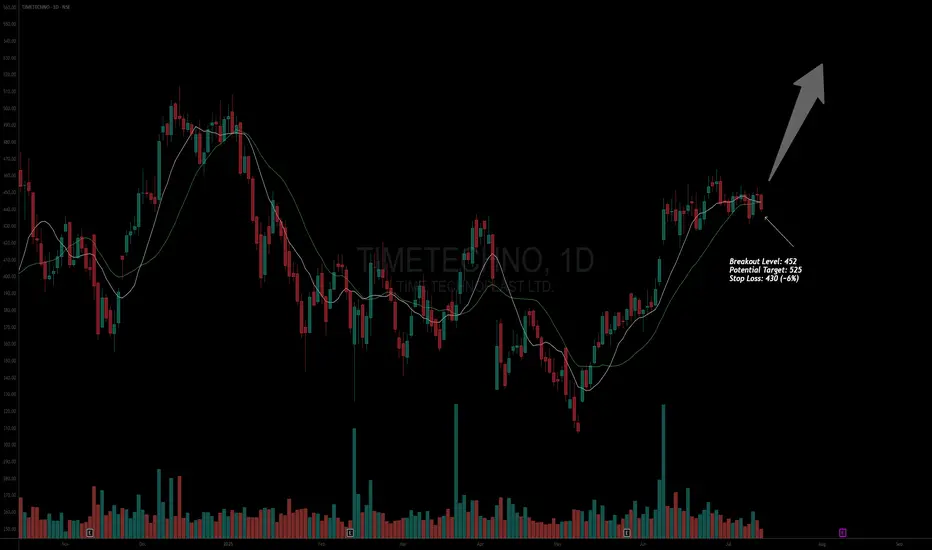
Asset: Time Technoplast Ltd (TIMETECHNO)
Breakout Level: 452
Potential Target: 525
Stop Loss: 430 (~6%)
Timeframe: Short to Medium term
Risk to Reward ratio : 1:3
Rationale:
Fundamentals -
Fundamentally decent stock with the following attributes:
* ROCE - 17.4%
* ROE - 14.2%
* Debt to Equity - 0.25
* Stock PE 25.7 / Industry PE - 26.6 || Stock PBV 3.45 / Industry PBV 2.97 - Company is slightly underpriced
* EPS / Revenue - Increasing over last 6 months
Technicals -
* Consolidating after a high volume up move
* Price is surfing the 10/20 DMA
* 200 DMA is forming a slightly increasing structure
* Multiple timeframe analysis - Not much to be gathered from monthly charts however weekly charts are showing consolidation as well
* RS is increasing
* ADR 3.1%
Market analysis
* Forecasted for ~31% further increase
* Promoter holding at 51% and remains steady
* FIIs/DIIs increasing holding / Not much MF activity
* Retail reducing
Cons
* Momentum is slow and ADR is low
This analysis is for educational purposes only and should not be considered as financial advice. Trading and investing in financial markets involve significant risk, and past performance is not indicative of future results. You should conduct your own research and consult with a qualified financial advisor before making any trading or investment decisions. The author is not responsible for any financial losses or damages that may result from the use of this information.
Penafian
Maklumat dan penerbitan adalah tidak dimaksudkan untuk menjadi, dan tidak membentuk, nasihat untuk kewangan, pelaburan, perdagangan dan jenis-jenis lain atau cadangan yang dibekalkan atau disahkan oleh TradingView. Baca dengan lebih lanjut di Terma Penggunaan.
Penafian
Maklumat dan penerbitan adalah tidak dimaksudkan untuk menjadi, dan tidak membentuk, nasihat untuk kewangan, pelaburan, perdagangan dan jenis-jenis lain atau cadangan yang dibekalkan atau disahkan oleh TradingView. Baca dengan lebih lanjut di Terma Penggunaan.