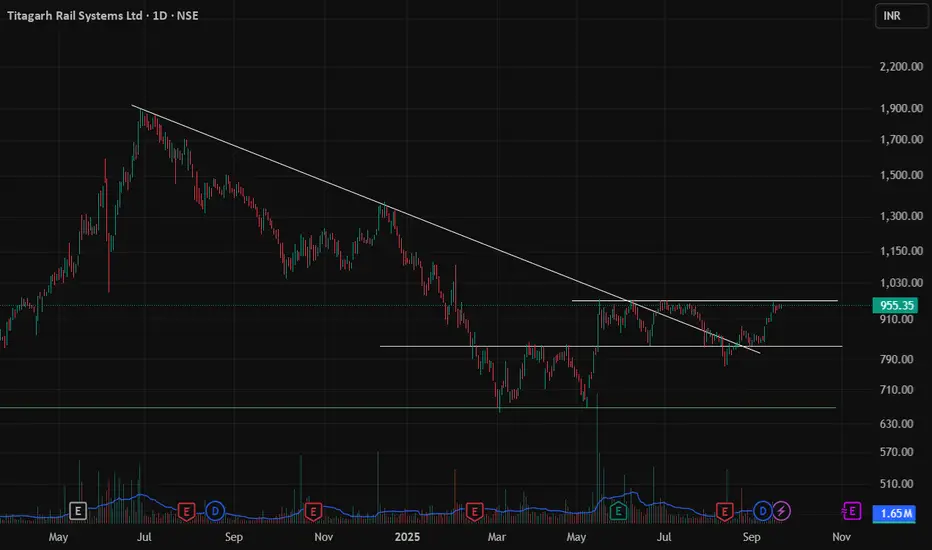
Titagarh Rail is trading near 955, showing a strong recovery after breaking its long-term downtrend line. The stock has formed a solid base around 790–800 and has been moving higher with strong momentum. Currently, it is testing the resistance zone near 960–1000.
If it sustains above this resistance, it may open the path towards higher levels in the coming sessions.
🔑 Key Levels:
✅ Support: 910 / 880 / 800
✅ Resistance: 960 / 1030 / 1100
✅ Trend: Bullish reversal after breakout from downtrend
📈 The breakout structure suggests strength, with rising volumes confirming accumulation. Sustaining above 960 could be a strong sign for further upside towards 1030+.
⚠️ This analysis is for educational purpose only, not a buy recommendation.
Penafian
Maklumat dan penerbitan adalah tidak dimaksudkan untuk menjadi, dan tidak membentuk, nasihat untuk kewangan, pelaburan, perdagangan dan jenis-jenis lain atau cadangan yang dibekalkan atau disahkan oleh TradingView. Baca dengan lebih lanjut di Terma Penggunaan.
Penafian
Maklumat dan penerbitan adalah tidak dimaksudkan untuk menjadi, dan tidak membentuk, nasihat untuk kewangan, pelaburan, perdagangan dan jenis-jenis lain atau cadangan yang dibekalkan atau disahkan oleh TradingView. Baca dengan lebih lanjut di Terma Penggunaan.