🔍 Technical Structure:
1. Base Formation & Breakout
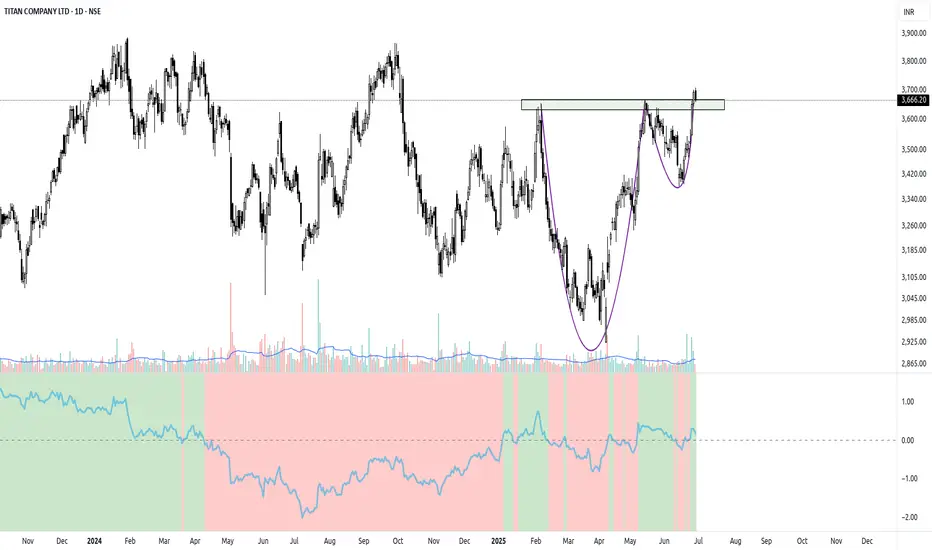
Titan was consolidating in a well-defined sideways range between ~₹3,400 and ₹3,670 for the last four months.
A clean breakout above the range occurred recently, marking a bullish change of character.
The breakout was accompanied by above-average volume, suggesting institutional activity.
2. Retest in Progress
After the breakout, price is pulling back to retest the breakout zone (~₹3,640–₹3,670).
This retest is healthy as long as it stays above previous resistance. If it dips too far below ₹3,640 and sustains, it may invalidate the breakout (a.k.a. false breakout).
3. Volatility Contraction Pattern (VCP)
Leading up to the breakout, Titan displayed progressively tighter price contractions.
This Volatility Contraction Pattern is a classic setup where price compresses before expanding explosively.
If the stock consolidates for a few more sessions with lower volatility and tight ranges near support, it could form a final contraction leg, potentially followed by a strong breakout.
4. Relative Strength
The Relative Strength (RS) line vs Nifty has turned positive on the weekly chart – an early sign that Titan may start outperforming the index again.
On the daily, RS has been rising steadily since early June, aligning with bullish price structure.
5. Moving Averages Alignment
The stock is currently trading above all major moving averages (20, 50, 100, 200 EMA), which are now in a bullish alignment.
The 200 EMA acted as dynamic support in the earlier stages of the base.
📈 Trading Plan & Bias
Bullish Bias (if base retest holds):
A successful retest of the breakout zone (around ₹3,640–₹3,670) with a bounce on volume could trigger the next leg higher.
Potential target zones: previous swing highs and psychological levels (₹3,800+, possibly ₹4,000 over time).
Invalidation / Risk:
A breakdown back into the range and sustained trade below ₹3,600 could imply a false breakout.
Wait for a decisive reclaim in that case.
Conclusion
Titan looks technically strong after breaking out from a multi-month range.
While the current pullback might look like weakness on the surface, this could be a textbook retest or a final contraction before a strong upside move.
Keep this stock on your radar for:
1. Base Formation & Breakout
Titan was consolidating in a well-defined sideways range between ~₹3,400 and ₹3,670 for the last four months.
A clean breakout above the range occurred recently, marking a bullish change of character.
The breakout was accompanied by above-average volume, suggesting institutional activity.
2. Retest in Progress
After the breakout, price is pulling back to retest the breakout zone (~₹3,640–₹3,670).
This retest is healthy as long as it stays above previous resistance. If it dips too far below ₹3,640 and sustains, it may invalidate the breakout (a.k.a. false breakout).
3. Volatility Contraction Pattern (VCP)
Leading up to the breakout, Titan displayed progressively tighter price contractions.
This Volatility Contraction Pattern is a classic setup where price compresses before expanding explosively.
If the stock consolidates for a few more sessions with lower volatility and tight ranges near support, it could form a final contraction leg, potentially followed by a strong breakout.
4. Relative Strength
The Relative Strength (RS) line vs Nifty has turned positive on the weekly chart – an early sign that Titan may start outperforming the index again.
On the daily, RS has been rising steadily since early June, aligning with bullish price structure.
5. Moving Averages Alignment
The stock is currently trading above all major moving averages (20, 50, 100, 200 EMA), which are now in a bullish alignment.
The 200 EMA acted as dynamic support in the earlier stages of the base.
📈 Trading Plan & Bias
Bullish Bias (if base retest holds):
A successful retest of the breakout zone (around ₹3,640–₹3,670) with a bounce on volume could trigger the next leg higher.
Potential target zones: previous swing highs and psychological levels (₹3,800+, possibly ₹4,000 over time).
Invalidation / Risk:
A breakdown back into the range and sustained trade below ₹3,600 could imply a false breakout.
Wait for a decisive reclaim in that case.
Conclusion
Titan looks technically strong after breaking out from a multi-month range.
While the current pullback might look like weakness on the surface, this could be a textbook retest or a final contraction before a strong upside move.
Keep this stock on your radar for:
- Bounce confirmation near support
- Breakout from a tighter VCP
- Volume-led upmove resumption
Penafian
Maklumat dan penerbitan adalah tidak dimaksudkan untuk menjadi, dan tidak membentuk, nasihat untuk kewangan, pelaburan, perdagangan dan jenis-jenis lain atau cadangan yang dibekalkan atau disahkan oleh TradingView. Baca dengan lebih lanjut di Terma Penggunaan.
Penafian
Maklumat dan penerbitan adalah tidak dimaksudkan untuk menjadi, dan tidak membentuk, nasihat untuk kewangan, pelaburan, perdagangan dan jenis-jenis lain atau cadangan yang dibekalkan atau disahkan oleh TradingView. Baca dengan lebih lanjut di Terma Penggunaan.