Analysis:
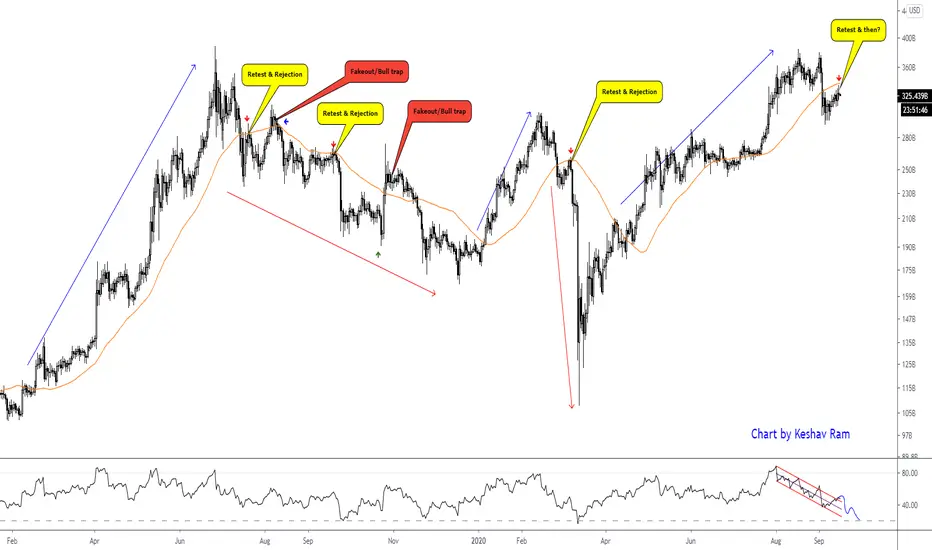
Conclusion: Uptrend ends when there is a big red daily candle below 50DMA, 2nd confirmation is a retest of the 50DMA and rejection. This happened after June 2019 top and Feb 2020 top
Observation: We have a major daily red candle cut through 50DMA like butter. Expect a retest like prev 2 times and that will be a great short opportunity with min target to 200DMA
LTF shows 5 waves are done, so a move to 323B (0.382 ) or 333B (0.5Fib + 50DMA)
Expect a drop to
260 B - 200DMA
236 B -0.382Fib
200 B - 0.5Fib
175 B - 0.618Fib
Invalidation: Breaking above and staying above 50DMA
Summary:
-Bearish below 50DMA
-Expect retest and rejection at 50DMA
-Final bearish confirmation below 200DMA
- In an uptrend, index needs to be over 50DMA (orange)
In 2019 rally, 50DMA was not retested
In March, 2020 rally, 50DMA was briefly lost
In a downtrend, index will drop below, retest and get rejected from 50DMA
50DMA lost in July 2019, retested 2 times in July and August
50DMA lost and retest failed in March 2020 crash
Index needs to drop below 200DMA as final confirmation (see Nov 2015)
Conclusion: Uptrend ends when there is a big red daily candle below 50DMA, 2nd confirmation is a retest of the 50DMA and rejection. This happened after June 2019 top and Feb 2020 top
Observation: We have a major daily red candle cut through 50DMA like butter. Expect a retest like prev 2 times and that will be a great short opportunity with min target to 200DMA
LTF shows 5 waves are done, so a move to 323B (0.382 ) or 333B (0.5Fib + 50DMA)
Expect a drop to
260 B - 200DMA
236 B -0.382Fib
200 B - 0.5Fib
175 B - 0.618Fib
Invalidation: Breaking above and staying above 50DMA
Summary:
-Bearish below 50DMA
-Expect retest and rejection at 50DMA
-Final bearish confirmation below 200DMA
Follow me for more updates
twitter.com/imkeshav
youtube.com/channel/UCskbBdZstBUQ_4y2o912zzw
twitter.com/imkeshav
youtube.com/channel/UCskbBdZstBUQ_4y2o912zzw
Penafian
Maklumat dan penerbitan adalah tidak dimaksudkan untuk menjadi, dan tidak membentuk, nasihat untuk kewangan, pelaburan, perdagangan dan jenis-jenis lain atau cadangan yang dibekalkan atau disahkan oleh TradingView. Baca dengan lebih lanjut di Terma Penggunaan.