TOTAL : Bullish Breakout from Falling Channel at Key Demand Zone
The current chart of TOTAL (total cryptocurrency market capitalization) presents a compelling bullish setup. Price action has formed a falling channel pattern, which is often a bullish continuation/reversal indicator when observed after a prior uptrend — as seen in the earlier impulsive rally.
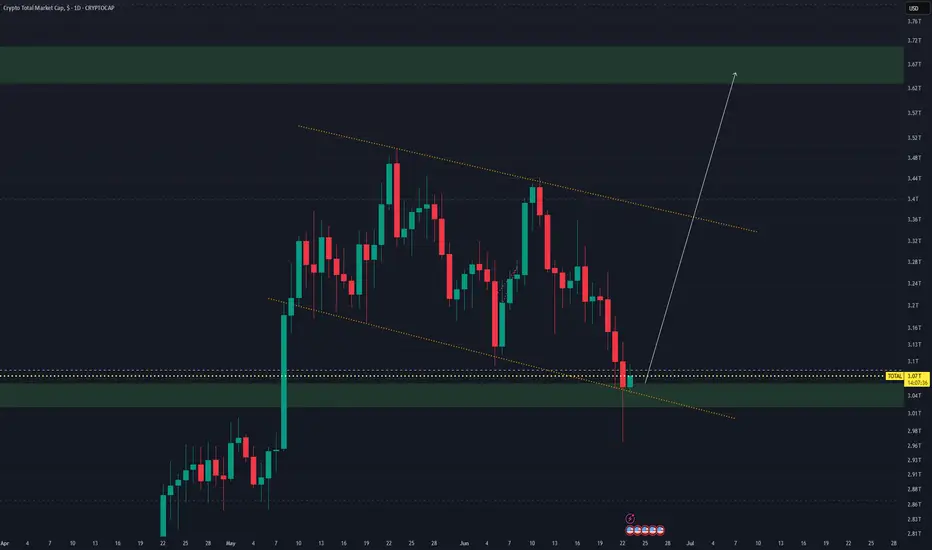
At present, the market cap has reached a significant demand zone around $3.04T–$3.07T, aligning with both:
- A key horizontal support level (highlighted by the white dashed line), and
- The lower boundary of the descending channel (marked with orange trendlines).
Notably, there was a strong wick rejection to the downside, indicating buyer interest and defense of this support zone. The chart suggests that this area has acted as a springboard for accumulation, and may catalyze a reversal breakout.
The projected move is a rally toward the upper green resistance zone, which lies between $3.62T to $3.70T — a previously established supply zone. The clean and aggressive white arrow illustrates a bullish trajectory that could reflect the next major leg up, should this bounce materialize into a breakout above the channel.
This scenario is further supported by:
- Strong confluence of support levels.
- A complete and respected descending channel structure.
- Positive market sentiment re-entering at macro-cap levels.
Key Levels:
- Support Zone: $3.04T – $3.07T
- Resistance Zone (Target): $3.62T – $3.70T
- Pattern: Descending Channel (Bullish Reversal Potential)
- Risk: Breakdown below $3.00T would invalidate the setup.
If momentum continues as anticipated, this could mark the beginning of a new bullish expansion phase across the crypto market.
Penafian
Maklumat dan penerbitan adalah tidak dimaksudkan untuk menjadi, dan tidak membentuk, nasihat untuk kewangan, pelaburan, perdagangan dan jenis-jenis lain atau cadangan yang dibekalkan atau disahkan oleh TradingView. Baca dengan lebih lanjut di Terma Penggunaan.
Penafian
Maklumat dan penerbitan adalah tidak dimaksudkan untuk menjadi, dan tidak membentuk, nasihat untuk kewangan, pelaburan, perdagangan dan jenis-jenis lain atau cadangan yang dibekalkan atau disahkan oleh TradingView. Baca dengan lebih lanjut di Terma Penggunaan.