$TOTAL2 vs BTC shows momentum with $TOTAL2 nearing ATH
Where is the Alt season?  TOTAL2 is the best indicator of the Altcoin rally which does not include
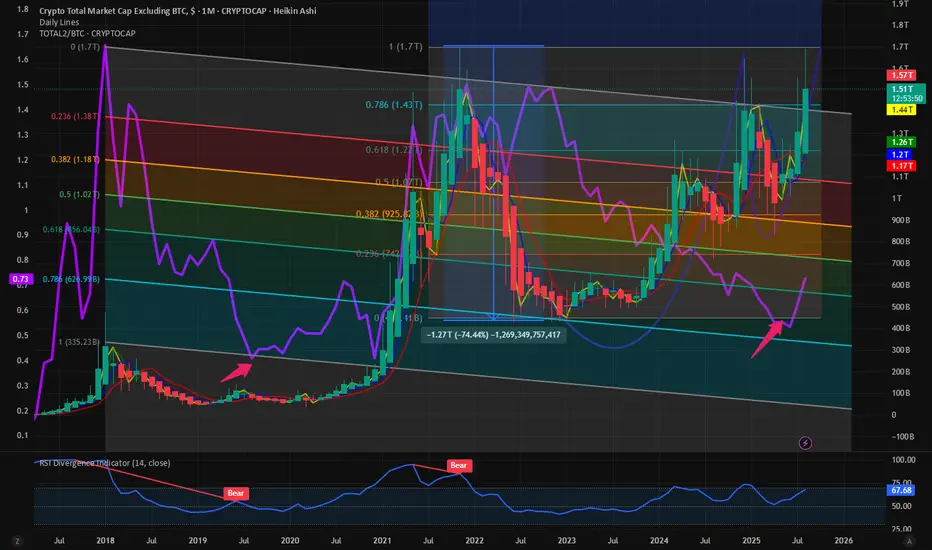
  BTC and Stablecoins. TOTAL2 peaked at 1.7 T $ in the last cycle. In this cycle we are very close to our target. But this outperformance can only happen if
  ETH breaks out above its previous cycle highs. Please visit my view on ETH and ETH.D in this blog.
BTC.D: Cycle tops are in. ETH.D: Bounce form the all-time lows for CRYPTOCAP:BTC.D by RabishankarBiswal — TradingView
Our target is 9K on $ETH. So if this happens then theTOTAL2 will break out of the Cup and handle formation we have been tracking since months on $TOTAL2. As the TOTAL2 is trying to break out of its ATH the ratio of TOTAL2 vs BTC is also making a reversal towards the upside. In the chart below I tried an unorthodox method to plot the Fib retracement levels of a downward slopping pattern joining the top of the lower lows in the ratio charts. Here we can clearly see that in this cycle it bottomed out at somewhere near to 0.786 level. Just extrapolating and following the pattern of lower lows and lower levels on the Fib retracement level I can predict to a certain degree of confidence that the ratio of TOTAL2 vs BTC can top out at 1.1 during this cycle. And the TOTAL2 might top out @ 2.6 T – 2.7 T $ which indicates a 60% rally to the next Fib retracement level on $TOTAL2.
Verdict :TOTAL2 vs BTC chart is on rally mode. TOTAL2 target remains 2.7 T $ and TOTAL2 vs BTC ratio target 1.1.
Our target is 9K on $ETH. So if this happens then the
Verdict :
Penerbitan berkaitan
Penafian
Maklumat dan penerbitan adalah tidak dimaksudkan untuk menjadi, dan tidak membentuk, nasihat untuk kewangan, pelaburan, perdagangan dan jenis-jenis lain atau cadangan yang dibekalkan atau disahkan oleh TradingView. Baca dengan lebih lanjut di Terma Penggunaan.
Penerbitan berkaitan
Penafian
Maklumat dan penerbitan adalah tidak dimaksudkan untuk menjadi, dan tidak membentuk, nasihat untuk kewangan, pelaburan, perdagangan dan jenis-jenis lain atau cadangan yang dibekalkan atau disahkan oleh TradingView. Baca dengan lebih lanjut di Terma Penggunaan.