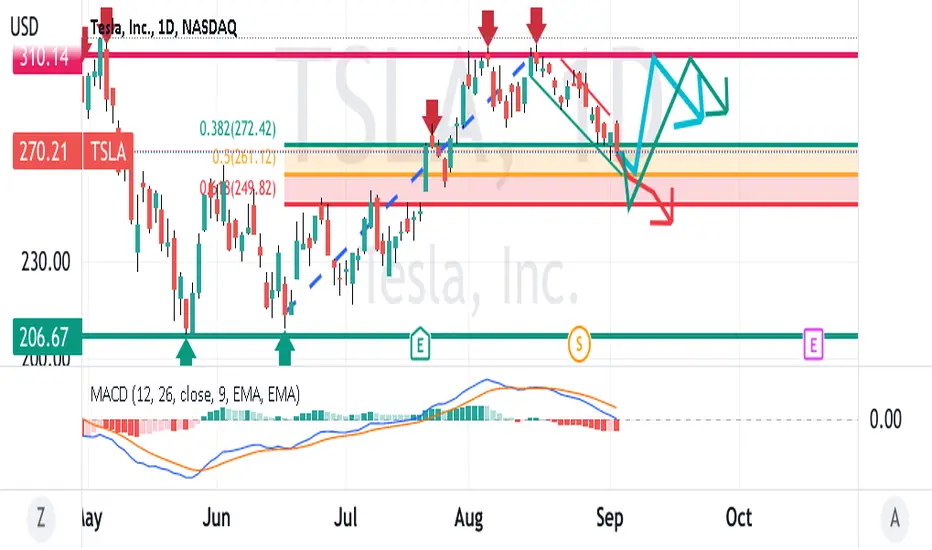
TSLA on the daily chart has mid-Fibonacci levels on the retracement of the uptrend serving
as support. The MACD has the K/D lines with a crossover above the low amplitude histogram.
So the question is wil TSLA break those supports and head lower or instead
will it bounce off of one or the other and uptrend towards overhead resistance.
What is your optinion?
Dagangan aktif
TSLA call option for September 16th is performing well as pricehas risen. I will begin taking profits on them when price gets to $308
and complete those when price hits $309.75 as alerted by preset alerts.
Penafian
Maklumat dan penerbitan adalah tidak bertujuan, dan tidak membentuk, nasihat atau cadangan kewangan, pelaburan, dagangan atau jenis lain yang diberikan atau disahkan oleh TradingView. Baca lebih dalam Terma Penggunaan.
Penafian
Maklumat dan penerbitan adalah tidak bertujuan, dan tidak membentuk, nasihat atau cadangan kewangan, pelaburan, dagangan atau jenis lain yang diberikan atau disahkan oleh TradingView. Baca lebih dalam Terma Penggunaan.