Tesla (
🔍 Key Technical Developments:
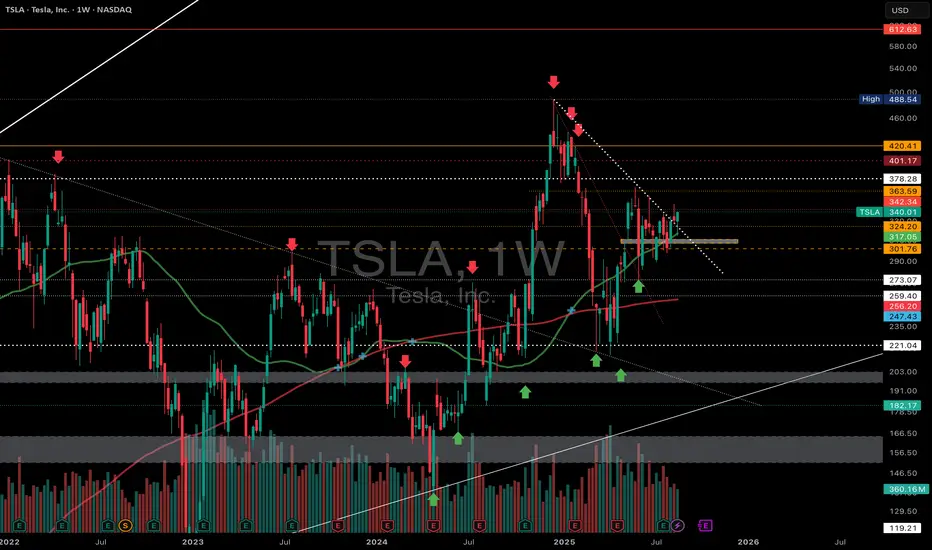
• Break of Downtrend: Price broke above the descending trendline (dotted white) that had been rejecting rallies since the $488 peak. This breakout was followed by consolidation just above support.
• Support Zone: The $320–$325 region (highlighted box) has been tested multiple times and is now acting as a solid demand area.
• Moving Averages: TSLA is holding above both the 50 day (green) and 200-day (red) MAs bullish posture.
• Trend Reversal Structure: Higher lows forming since April 2025, supported by increasing volume on up moves a constructive bullish base.
📌 Key Levels to Watch:
• Resistance:
◦ $342.34 (current test)
◦ $363.59 (next major level)
◦ $378.28 and $401.17 as higher resistance zones
• Support:
◦ $324.20 / $321.84
◦ $301.76
◦ Below that: $273.07
📈 Current Price: $340.01 (+6.22%)
Tesla is attempting to break out of a long-term downtrend structure. A sustained move above $342–$344 could ignite momentum toward $360+.
📊 Watch for volume confirmation and reaction at major resistance zones.
#Tesla #TSLA #Stocks #TechnicalAnalysis #Breakout #ElonMusk #Trading #NASDAQ
Penafian
Maklumat dan penerbitan adalah tidak dimaksudkan untuk menjadi, dan tidak membentuk, nasihat untuk kewangan, pelaburan, perdagangan dan jenis-jenis lain atau cadangan yang dibekalkan atau disahkan oleh TradingView. Baca dengan lebih lanjut di Terma Penggunaan.
Penafian
Maklumat dan penerbitan adalah tidak dimaksudkan untuk menjadi, dan tidak membentuk, nasihat untuk kewangan, pelaburan, perdagangan dan jenis-jenis lain atau cadangan yang dibekalkan atau disahkan oleh TradingView. Baca dengan lebih lanjut di Terma Penggunaan.