TSLA Weekly Outlook (Oct 28–31): “Charging Toward 470 or Cooling at the Top?” ⚡
1. Weekly (1W) Structure – Big Picture
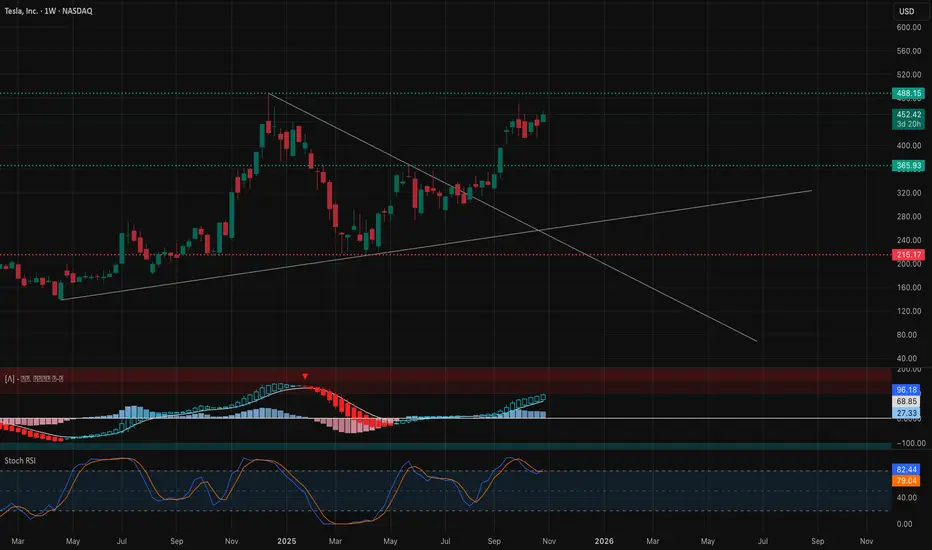
Tesla is in a strong bullish continuation phase, showing a clear Break of Structure (BOS) above $367 and holding momentum above $450. The downtrend line from the 2023 high was broken, confirming a long-term structural reversal. Price is now consolidating near $452–$460, forming a possible higher-low setup before a push to $488–$500 zone.
* Bias: Bullish continuation unless price closes below $411.
* Support: $367 → $411 zone
* Resistance: $470 → $488 zone
* MACD: Expanding bullish histogram, showing momentum strength.
* Stochastic: Near overbought but still trending upward.
💡 Weekly Thought: Tesla’s higher timeframe looks ready for another leg up, but a mild pullback to $430–$440 wouldn’t hurt the structure—it would actually create a healthy base for November.
2. Daily (1D) – Momentum Check

The daily chart confirms a strong BOS and ascending channel. After testing the channel’s lower boundary ($411–$420), Tesla rebounded cleanly toward $452. Price is attempting to reclaim the midline of the ascending channel, signaling renewed bullish control.
* Bias: Bullish bias, but short-term profit-taking likely near $460–$470.
* Support: $411 → $420 (demand zone)
* Resistance: $460 → $470 (channel top)
* Indicators:
* MACD turning positive after extended red bars.
* Stochastic curling up from mid-levels — bullish swing signal.
💭 Daily Suggestion: Buyers should stay patient for pullbacks near $440–$445 to re-enter. Short-term traders can target $468–$470 if price holds above $452 with volume.
3. 1-Hour (1H) – Short-Term Game Plan

Tesla is holding above the intraday uptrend line, with clear Breaks of Structure (BOS) around $451–$455. The immediate zone to watch is the $449–$451 range, acting as dynamic support. As long as Tesla holds this area, intraday bulls maintain control.
* Scalp Bias: Bullish as long as price stays > $449
* Immediate Resistance: $455 → $465
* Support: $439 → $445
* Setup Idea:
* Call scalp: Above $455 for target $462–$468
* Put scalp: Only if breaks below $445 with volume
📈 1H Thought: If Tesla consolidates sideways around $450–$455 early week, it sets up a launch toward $470 later in the week.
4. GEX & Options Sentiment – Institutional Flow Insight

The Gamma Exposure (GEX) map shows clear call dominance:
* Highest positive GEX wall / resistance: $455–$460
* 2nd & 3rd Call Walls: $465 → $470 → $480
* Put walls / downside support: $430 → $415 → $400
Key Metrics:
* GEX Bias: +57.2% Calls
* IVR: 15.5 (low volatility environment)
* IVx avg: 60.2% (vol compression likely → bullish)
Institutions are positioned bullishly with heavy call exposure at $460–$470, acting as a near-term magnet. The $430–$415 range remains protected by put walls—making it a tough zone to break down through unless macro turns negative.
5. Suggested Option Plays
* Bullish Setup (Preferred):
* Buy-to-open 460C (1DTE/2DTE) if price reclaims $455–$457 with volume.
* Target: $470
* Stop: Below $445
* Reason: Strong call gamma wall at $460 + breakout potential.
* Bearish Hedge (Cautious traders):
* Buy 440P (1DTE/2DTE) only if TSLA breaks $445 on volume.
* Target: $430
* Stop: Above $455
6. My Take for Oct 28–31
Tesla is showing clean bullish structure across all timeframes.
* Weekly confirms a higher low and BOS continuation.
* Daily is aligned within an ascending channel.
* 1H shows intraday bullish trendline support.
* GEX confirms call-dominant sentiment toward $470.
If macro markets remain stable, TSLA likely tests $468–$470 this week, possibly stalling there for profit-taking. A rejection near that level would bring $440–$445 back into play for reload.
🎯 Primary Bias: Bullish toward $470 ⚠️ Watch For: Failing to hold $445 = possible short-term correction.
Disclaimer: This analysis is for educational purposes only and not financial advice. Always manage your risk and perform your own due diligence before trading options or equities.
1. Weekly (1W) Structure – Big Picture
Tesla is in a strong bullish continuation phase, showing a clear Break of Structure (BOS) above $367 and holding momentum above $450. The downtrend line from the 2023 high was broken, confirming a long-term structural reversal. Price is now consolidating near $452–$460, forming a possible higher-low setup before a push to $488–$500 zone.
* Bias: Bullish continuation unless price closes below $411.
* Support: $367 → $411 zone
* Resistance: $470 → $488 zone
* MACD: Expanding bullish histogram, showing momentum strength.
* Stochastic: Near overbought but still trending upward.
💡 Weekly Thought: Tesla’s higher timeframe looks ready for another leg up, but a mild pullback to $430–$440 wouldn’t hurt the structure—it would actually create a healthy base for November.
2. Daily (1D) – Momentum Check
The daily chart confirms a strong BOS and ascending channel. After testing the channel’s lower boundary ($411–$420), Tesla rebounded cleanly toward $452. Price is attempting to reclaim the midline of the ascending channel, signaling renewed bullish control.
* Bias: Bullish bias, but short-term profit-taking likely near $460–$470.
* Support: $411 → $420 (demand zone)
* Resistance: $460 → $470 (channel top)
* Indicators:
* MACD turning positive after extended red bars.
* Stochastic curling up from mid-levels — bullish swing signal.
💭 Daily Suggestion: Buyers should stay patient for pullbacks near $440–$445 to re-enter. Short-term traders can target $468–$470 if price holds above $452 with volume.
3. 1-Hour (1H) – Short-Term Game Plan
Tesla is holding above the intraday uptrend line, with clear Breaks of Structure (BOS) around $451–$455. The immediate zone to watch is the $449–$451 range, acting as dynamic support. As long as Tesla holds this area, intraday bulls maintain control.
* Scalp Bias: Bullish as long as price stays > $449
* Immediate Resistance: $455 → $465
* Support: $439 → $445
* Setup Idea:
* Call scalp: Above $455 for target $462–$468
* Put scalp: Only if breaks below $445 with volume
📈 1H Thought: If Tesla consolidates sideways around $450–$455 early week, it sets up a launch toward $470 later in the week.
4. GEX & Options Sentiment – Institutional Flow Insight
The Gamma Exposure (GEX) map shows clear call dominance:
* Highest positive GEX wall / resistance: $455–$460
* 2nd & 3rd Call Walls: $465 → $470 → $480
* Put walls / downside support: $430 → $415 → $400
Key Metrics:
* GEX Bias: +57.2% Calls
* IVR: 15.5 (low volatility environment)
* IVx avg: 60.2% (vol compression likely → bullish)
Institutions are positioned bullishly with heavy call exposure at $460–$470, acting as a near-term magnet. The $430–$415 range remains protected by put walls—making it a tough zone to break down through unless macro turns negative.
5. Suggested Option Plays
* Bullish Setup (Preferred):
* Buy-to-open 460C (1DTE/2DTE) if price reclaims $455–$457 with volume.
* Target: $470
* Stop: Below $445
* Reason: Strong call gamma wall at $460 + breakout potential.
* Bearish Hedge (Cautious traders):
* Buy 440P (1DTE/2DTE) only if TSLA breaks $445 on volume.
* Target: $430
* Stop: Above $455
6. My Take for Oct 28–31
Tesla is showing clean bullish structure across all timeframes.
* Weekly confirms a higher low and BOS continuation.
* Daily is aligned within an ascending channel.
* 1H shows intraday bullish trendline support.
* GEX confirms call-dominant sentiment toward $470.
If macro markets remain stable, TSLA likely tests $468–$470 this week, possibly stalling there for profit-taking. A rejection near that level would bring $440–$445 back into play for reload.
🎯 Primary Bias: Bullish toward $470 ⚠️ Watch For: Failing to hold $445 = possible short-term correction.
Disclaimer: This analysis is for educational purposes only and not financial advice. Always manage your risk and perform your own due diligence before trading options or equities.
Penafian
Maklumat dan penerbitan adalah tidak dimaksudkan untuk menjadi, dan tidak membentuk, nasihat untuk kewangan, pelaburan, perdagangan dan jenis-jenis lain atau cadangan yang dibekalkan atau disahkan oleh TradingView. Baca dengan lebih lanjut di Terma Penggunaan.
Penafian
Maklumat dan penerbitan adalah tidak dimaksudkan untuk menjadi, dan tidak membentuk, nasihat untuk kewangan, pelaburan, perdagangan dan jenis-jenis lain atau cadangan yang dibekalkan atau disahkan oleh TradingView. Baca dengan lebih lanjut di Terma Penggunaan.