Technical Analysis (Weekly Chart – TSLA, NASDAQ):
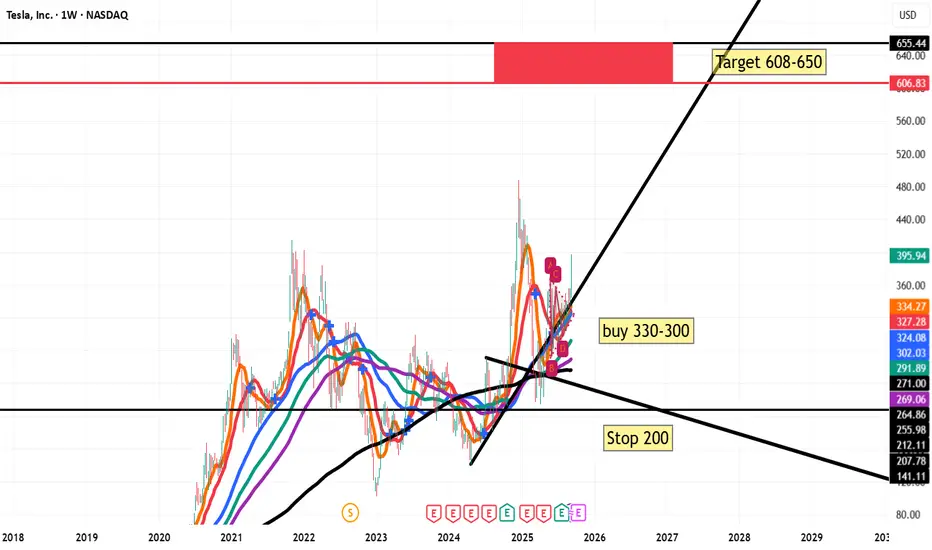
Current Price: $395.94 (+12.85% in the latest session), showing strong bullish momentum.
Support Zone (Buy Area): The chart highlights an attractive buying range between $300–330, where multiple moving averages converge, acting as dynamic support.
Stop-Loss: Placed at $200, which sits well below the long-term trendline and previous key support. This ensures risk control in case of a major reversal.
Target Zone: The bullish projection is toward the $608–650 area, aligning with previous resistance levels and a strong supply zone from 2021–2022.
Trend & Structure:
The stock recently broke out of a consolidation pattern (A–B–C–D) with strength, supported by high volume and upward momentum.
Long-term moving averages (200-week shown in black) are flattening and turning up, signaling a potential multi-year bullish reversal.
If price sustains above $330, the bullish scenario remains valid with the probability of continuation toward $600+.
Outlook:
Short-term: Possible minor retracement to $330–350 before resuming the uptrend.
Medium- to Long-term: Bullish trend continuation toward $608–650.
Risk: A breakdown below $300 would weaken the bullish case, and a fall under $200 would invalidate it completely.
📌 Summary:
Tesla shows a strong bullish setup on the weekly chart. Entry zone is $300–330 with stop-loss at $200. The first major target is $608–650, offering an excellent risk–reward ratio for long-term investors.
Penafian
The information and publications are not meant to be, and do not constitute, financial, investment, trading, or other types of advice or recommendations supplied or endorsed by TradingView. Read more in the Terms of Use.
Penafian
The information and publications are not meant to be, and do not constitute, financial, investment, trading, or other types of advice or recommendations supplied or endorsed by TradingView. Read more in the Terms of Use.