Stock investing strategies by pretiming
 TSLA
TSLA
Investing position about Supply-Demand(S&D) strength: Rising section of high profit & low risk
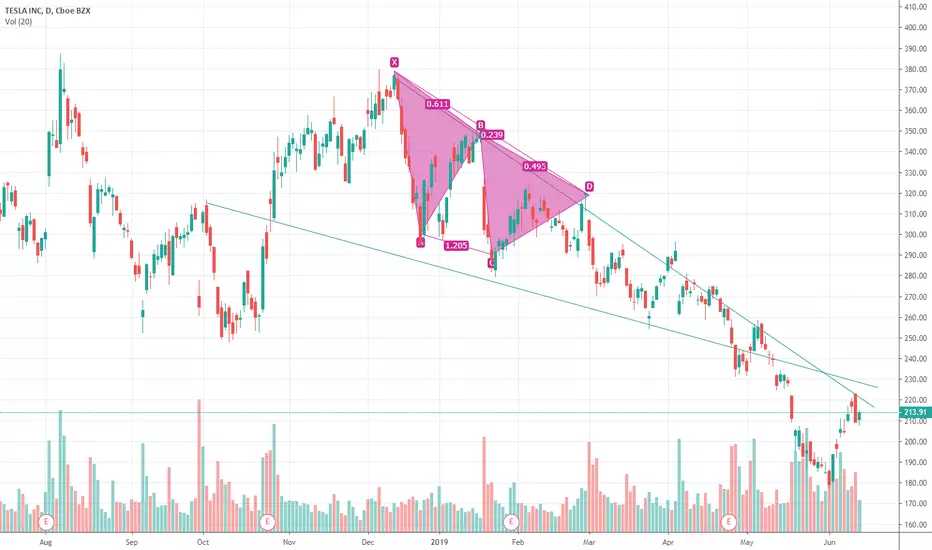
Supply-Demand(S&D) strength linkage Trend Analysis: In the midst of an adjustment trend of downward direction box pattern stock price flow marked by limited rises and downward fluctuations.
Today's Supply-Demand(S&D) strength Flow: Supply-Demand(S&D) strength flow appropriate to the current trend.
Possibility of change in forecast timing: Forecast timing has low variability conditions. because they maintain the proper flow of supply - demand in the current trend.
D+1 Candlestick Color forecast: GREEN Candlestick
%D+1 Range forecast: 0.5% (HIGH) ~ -1.4% (LOW)
%AVG in case of rising: 2.7% (HIGH) ~ -1.6% (LOW)
%AVG in case of falling: 0.7% (HIGH) ~ -3.1% (LOW)
Stock Price Forecast Timing Criteria: Stock price forecast timing is analyzed based on pretiming algorithm of Supply-Demand(S&D) strength.
Read more a detailed Forecast Analysis Reports that candlestick shape and %change, S&D strength flow in the future 7 days.
pretiming.com/search?q=tsla
Investing position about Supply-Demand(S&D) strength: Rising section of high profit & low risk
Supply-Demand(S&D) strength linkage Trend Analysis: In the midst of an adjustment trend of downward direction box pattern stock price flow marked by limited rises and downward fluctuations.
Today's Supply-Demand(S&D) strength Flow: Supply-Demand(S&D) strength flow appropriate to the current trend.
Possibility of change in forecast timing: Forecast timing has low variability conditions. because they maintain the proper flow of supply - demand in the current trend.
D+1 Candlestick Color forecast: GREEN Candlestick
%D+1 Range forecast: 0.5% (HIGH) ~ -1.4% (LOW)
%AVG in case of rising: 2.7% (HIGH) ~ -1.6% (LOW)
%AVG in case of falling: 0.7% (HIGH) ~ -3.1% (LOW)
Stock Price Forecast Timing Criteria: Stock price forecast timing is analyzed based on pretiming algorithm of Supply-Demand(S&D) strength.
Read more a detailed Forecast Analysis Reports that candlestick shape and %change, S&D strength flow in the future 7 days.
pretiming.com/search?q=tsla
Nota
18-JunStock investing strategies
View Chart that Supply-Demand(S&D) strength forecast: pretiming.com/search?q=tsla
Investing position about Supply-Demand(S&D) strength: In Rising section of high profit & low risk
S&D strength Trend Analysis: About to begin an adjustment trend as a upward trend gradually gives way to a slowdown in rises and falling fluctuations
Today's S&D strength Flow: Supply-Demand strength has changed to a strengthening buying flow when stock market opening.
D+1 Candlestick Color forecast: RED Candlestick
%D+1 Range forecast: 0.5% (HIGH) ~ -1.0% (LOW), -0.2% (CLOSE)
%AVG in case of rising: 2.8% (HIGH) ~ -1.4% (LOW), 2.2% (CLOSE)
%AVG in case of falling: 0.6% (HIGH) ~ -3.0% (LOW), -1.8% (CLOSE)
Stock Price Forecast Timing Criteria: Stock price forecast timing is analyzed based on pretiming algorithm of Supply-Demand(S&D) strength.
Penafian
Maklumat dan penerbitan adalah tidak dimaksudkan untuk menjadi, dan tidak membentuk, nasihat untuk kewangan, pelaburan, perdagangan dan jenis-jenis lain atau cadangan yang dibekalkan atau disahkan oleh TradingView. Baca dengan lebih lanjut di Terma Penggunaan.
Penafian
Maklumat dan penerbitan adalah tidak dimaksudkan untuk menjadi, dan tidak membentuk, nasihat untuk kewangan, pelaburan, perdagangan dan jenis-jenis lain atau cadangan yang dibekalkan atau disahkan oleh TradingView. Baca dengan lebih lanjut di Terma Penggunaan.