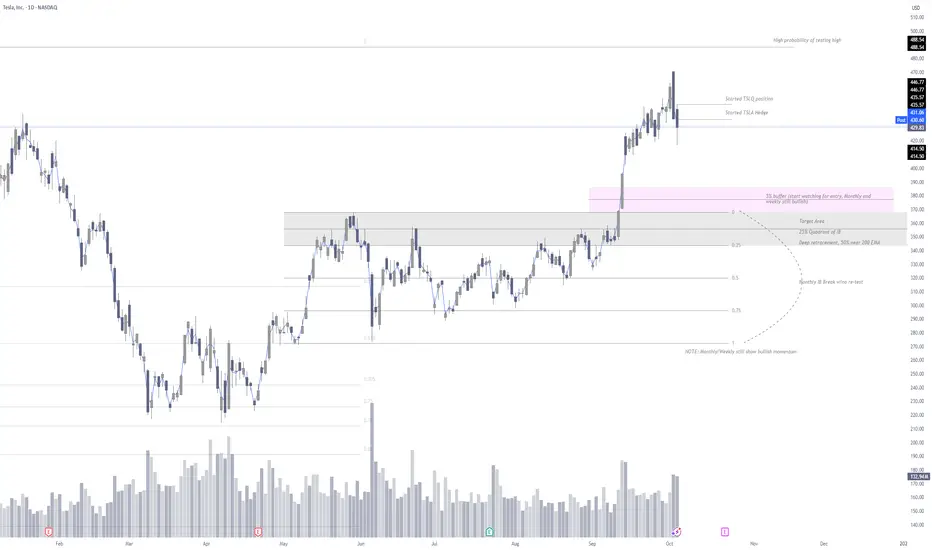
1. May/June Inside Bar: Broke to the upside on September with no re-test of break.
a. Higher timeframes take longer for this to re-test.
b. I have found that 18 days is an average re-test, but this is not 100%.
2. Daily chart shows pullback, but its extremely important to understand that the weekly and monthly show bullish momentum.
3. I have started a TSLQ short position adding slowly, with TSLA shares targeting ATH's.
4. The target is for TSLA to move back into the 5% buffer, where I will start looking for a long position. The inside bar is usually re-tested. If bullish momentum is still there, which the weekly and monthly still show, then the 5% buffer and 25% quadrant are entry zones. However, if something changes, then 50% quadrant should be the target.
Happy trading!
Penafian
Maklumat dan penerbitan adalah tidak dimaksudkan untuk menjadi, dan tidak membentuk, nasihat untuk kewangan, pelaburan, perdagangan dan jenis-jenis lain atau cadangan yang dibekalkan atau disahkan oleh TradingView. Baca dengan lebih lanjut di Terma Penggunaan.
Penafian
Maklumat dan penerbitan adalah tidak dimaksudkan untuk menjadi, dan tidak membentuk, nasihat untuk kewangan, pelaburan, perdagangan dan jenis-jenis lain atau cadangan yang dibekalkan atau disahkan oleh TradingView. Baca dengan lebih lanjut di Terma Penggunaan.