Tesla’s recent price action is stirring interest again, not just for retail traders but also for chart technicians who track Elliott Wave structures across global equities.
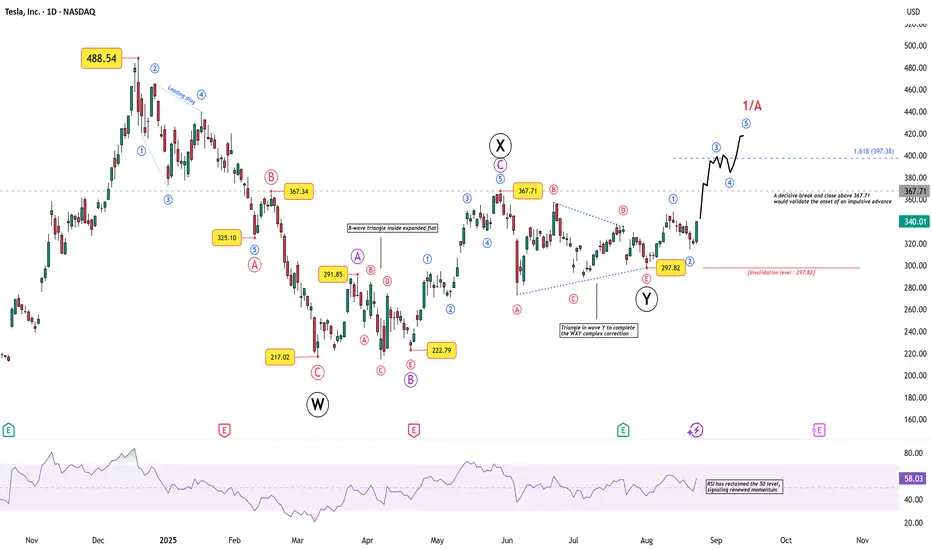
After a deep corrective phase that carried price down from 488.54 to 217.02, Tesla has been carving out a multi-layered corrective structure. Here’s the breakdown:
From that point, Tesla appears to have begun an impulsive sequence:
What Next?
If the count holds, Tesla could be in the early stages of a larger impulsive rally, with Wave 1/A projecting toward the 400–420 zone. However, traders should remember that breaking below 297.82 invalidates the impulsive outlook and revives the broader corrective scenario.
Disclaimer: This analysis is for educational purposes only and does not constitute investment advice. Please do your own research (DYOR) before making any trading decisions.
After a deep corrective phase that carried price down from 488.54 to 217.02, Tesla has been carving out a multi-layered corrective structure. Here’s the breakdown:
- Wave W completed into 217.02, marking a sharp low.
- This was followed by a complex X wave, which included an expanded flat where the B-wave unfolded as a triangle — a rare but valid corrective formation.
- Wave Y then ended with a contracting triangle, neatly completing the W–X–Y correction near 297.82.
From that point, Tesla appears to have begun an impulsive sequence:
- Wave 1 and 2 are already visible, with the 297.82 low as the key invalidation level.
- A decisive break and close above 367.71 would confirm the onset of Wave 3, targeting 397.38 (1.618× Wave 1).
- Momentum is supporting the structure: RSI has reclaimed the 50 level, hinting at renewed strength.
What Next?
If the count holds, Tesla could be in the early stages of a larger impulsive rally, with Wave 1/A projecting toward the 400–420 zone. However, traders should remember that breaking below 297.82 invalidates the impulsive outlook and revives the broader corrective scenario.
Disclaimer: This analysis is for educational purposes only and does not constitute investment advice. Please do your own research (DYOR) before making any trading decisions.
Dagangan aktif
WaveXplorer | Elliott Wave insights
📊 X profile: @veerappa89
📊 X profile: @veerappa89
Penafian
Maklumat dan penerbitan adalah tidak dimaksudkan untuk menjadi, dan tidak membentuk, nasihat untuk kewangan, pelaburan, perdagangan dan jenis-jenis lain atau cadangan yang dibekalkan atau disahkan oleh TradingView. Baca dengan lebih lanjut di Terma Penggunaan.
