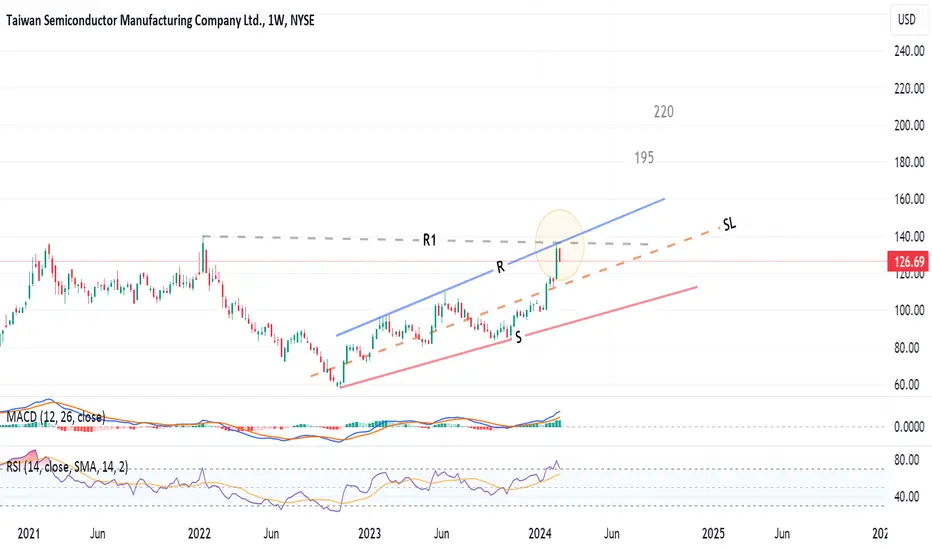
Weekly chart, the stock reached a cluster of resistances R1 and R, and could not cross.
There is a tendency to test the mid line or the support line S
Above the R line, a rising expanding wedge pattern will be completed, and the target will be 195 then 220
Stop loss below SL line
There is a tendency to test the mid line or the support line S
Above the R line, a rising expanding wedge pattern will be completed, and the target will be 195 then 220
Stop loss below SL line
Penafian
The information and publications are not meant to be, and do not constitute, financial, investment, trading, or other types of advice or recommendations supplied or endorsed by TradingView. Read more in the Terms of Use.
Penafian
The information and publications are not meant to be, and do not constitute, financial, investment, trading, or other types of advice or recommendations supplied or endorsed by TradingView. Read more in the Terms of Use.