This Supply Chain Giant is attempting to break out. After 6 Months of Consolidation - Is it Time to Load Up? Let's analyse today's Idea.
Price Action Analysis:
Current Market Structure:
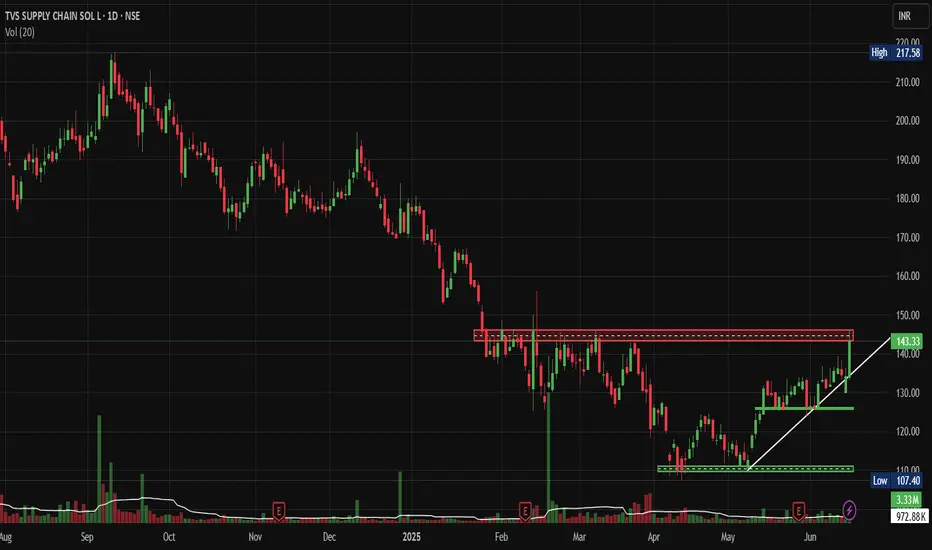
• Stock is currently trading at ₹143.33, showing a strong +6.83% gain
• Price has broken above a key resistance zone around the ₹140 level
• Clear uptrend formation with a higher highs and higher lows pattern emerging
• Recent breakout attempt from a prolonged consolidation phase
Historical Price Movement:
• Stock witnessed a sharp decline from highs of ₹217+ in late 2024 to lows around ₹107
• Extended consolidation phase from February to May 2025 between ₹110-145 levels
• Current breakout attempt suggests potential trend reversal from bearish to bullish
Volume Spread Analysis:
Volume Characteristics:
• Significant volume spike visible during the recent breakout session
• Volume of 3.33M is substantially higher than the 20-day average of 972.88K
• Volume confirmation supporting the price breakout attempt above resistance
• Previous volume spikes coincided with major price movements
Volume Price Relationship:
• Healthy volume-price relationship during the current upward move
• Relatively lower volumes accompanied earlier decline phases
• Current breakout attempt volume suggests institutional participation
Key Technical Levels:
Support Levels:
• Primary Support: ₹130-132 (previous resistance turned support)
• Secondary Support: ₹120-125 (consolidation zone low)
• Major Support: ₹110-115 (multi-month consolidation bottom)
Resistance Levels:
• Immediate Resistance: ₹150-155 (psychological level)
• Medium-term Resistance: ₹165-170 (previous swing high)
• Major Resistance: ₹185-190 (Fibonacci retracement level)
Base Formation:
• Rectangle consolidation pattern formed between ₹110-145 levels
• Base duration: Approximately 4-5 months (February to May 2025)
• Breakout from this base suggests potential for sustained upward movement
Technical Patterns:
Primary Patterns:
• Rectangle/Box pattern completion with upward breakout attempt
• Potential inverse head and shoulders pattern on a longer timeframe
• Ascending triangle formation in recent weeks before the breakout
Trend Analysis:
• Short-term trend: Bullish (breakout confirmed)
• Medium-term trend: Transitioning from bearish to bullish
• Long-term trend: Still in recovery phase from major decline
Trade Setup and Strategy:
Entry Strategy:
• Aggressive Entry: ₹143-145 (current levels on any minor pullback)
• Conservative Entry: ₹135-138 (on retest of breakout level)
• Volume confirmation is required for any entry
Position Sizing:
• Risk 1-2% of portfolio capital on this trade
• Position size calculation: Portfolio Value × Risk % ÷ Stop Loss Distance
• Example: For ₹1,00,000 portfolio with 2% risk = ₹2,000 risk capital
Risk-Reward Calculation:
• Risk-Reward Ratio: Minimum 1:2 preferred
• Expected risk per share: ₹15-20 based on stop loss placement
• Potential reward: ₹30-40 per share to the first target
Exit Strategy:
Profit Targets:
• Target 1: ₹165-170 (15-20% upside) - Book 40% position
• Target 2: ₹185-190 (30-35% upside) - Book 40% position
• Target 3: ₹200+ (40 %+ upside) - Trail remaining 20% position
Stop Loss Levels:
• Initial Stop Loss: ₹125-128 (below consolidation support)
• Trailing Stop: Move to breakeven once Target 1 is achieved
• Final Trail: Use 10-day EMA or ₹10-15 trailing stop
Risk Management Framework:
Risk Control Measures:
• Maximum loss per trade: 2% of total capital
• Position sizing based on stop loss distance
• No averaging down if the trade goes against the initial thesis
• Exit if the technical structure breaks down
Portfolio Allocation:
• Maximum exposure to single stock: 5-8% of portfolio
• Sector allocation limit: 15-20% to logistics/supply chain
• Maintain diversification across market caps and sectors
Sectoral Analysis:
Logistics and Supply Chain Sector:
• The sector has shown resilience post-pandemic disruptions
• Growing e-commerce and digitalization are driving demand
• Government infrastructure push benefiting logistics companies
• Increasing focus on supply chain optimization across industries
Sector Positioning:
• TVSSCS is positioned in the growing third-party logistics market
• Beneficiary of Make in India and manufacturing growth
• Automotive sector recovery supporting the company's core business
Fundamental Backdrop:
Business Overview:
• Leading third-party logistics and supply chain solutions provider
• Strong presence in automotive, consumer goods, and industrial sectors
• Integrated service offerings including warehousing, transportation, and value-added services
Growth Drivers:
• Expansion in new geographies and service offerings
• Technology-driven efficiency improvements
• Growing outsourcing trend in supply chain management
• Recovery in the automotive sector supporting traditional business
Market Outlook and Catalysts:
Positive Catalysts:
• New client acquisitions and contract wins
• Capacity expansion announcements
• Favourable government policies for the logistics sector
Risk Factors:
• Economic slowdown affecting industrial demand
• Fuel price volatility is impacting transportation costs
• Competitive pricing pressure in the logistics industry
• Global supply chain disruptions
My Take:
TVS Supply Chain Solutions presents a compelling technical setup with the recent breakout attempt from a multi-month consolidation. The combination of strong volume confirmation, supportive sectoral trends, and improving fundamental backdrop makes this an attractive opportunity for Short to medium-term investors. However, proper risk management and position sizing remain crucial for the successful execution of this trade setup.
Keep in the Watchlist.
NO RECO. For Buy/Sell.
📌Thank you for exploring my idea! I hope you found it valuable.
🙏FOLLOW for more
👍BOOST if you found it useful.
✍️COMMENT below with your views.
Meanwhile, check out my other stock ideas on the right side until this trade is activated. I would love your feedback.
Disclaimer: "I am not a SEBI REGISTERED RESEARCH ANALYST AND INVESTMENT ADVISER."
This analysis is intended solely for informational and educational purposes and should not be interpreted as financial advice. It is advisable to consult a qualified financial advisor or conduct thorough research before making investment decisions.
Price Action Analysis:
Current Market Structure:
• Stock is currently trading at ₹143.33, showing a strong +6.83% gain
• Price has broken above a key resistance zone around the ₹140 level
• Clear uptrend formation with a higher highs and higher lows pattern emerging
• Recent breakout attempt from a prolonged consolidation phase
Historical Price Movement:
• Stock witnessed a sharp decline from highs of ₹217+ in late 2024 to lows around ₹107
• Extended consolidation phase from February to May 2025 between ₹110-145 levels
• Current breakout attempt suggests potential trend reversal from bearish to bullish
Volume Spread Analysis:
Volume Characteristics:
• Significant volume spike visible during the recent breakout session
• Volume of 3.33M is substantially higher than the 20-day average of 972.88K
• Volume confirmation supporting the price breakout attempt above resistance
• Previous volume spikes coincided with major price movements
Volume Price Relationship:
• Healthy volume-price relationship during the current upward move
• Relatively lower volumes accompanied earlier decline phases
• Current breakout attempt volume suggests institutional participation
Key Technical Levels:
Support Levels:
• Primary Support: ₹130-132 (previous resistance turned support)
• Secondary Support: ₹120-125 (consolidation zone low)
• Major Support: ₹110-115 (multi-month consolidation bottom)
Resistance Levels:
• Immediate Resistance: ₹150-155 (psychological level)
• Medium-term Resistance: ₹165-170 (previous swing high)
• Major Resistance: ₹185-190 (Fibonacci retracement level)
Base Formation:
• Rectangle consolidation pattern formed between ₹110-145 levels
• Base duration: Approximately 4-5 months (February to May 2025)
• Breakout from this base suggests potential for sustained upward movement
Technical Patterns:
Primary Patterns:
• Rectangle/Box pattern completion with upward breakout attempt
• Potential inverse head and shoulders pattern on a longer timeframe
• Ascending triangle formation in recent weeks before the breakout
Trend Analysis:
• Short-term trend: Bullish (breakout confirmed)
• Medium-term trend: Transitioning from bearish to bullish
• Long-term trend: Still in recovery phase from major decline
Trade Setup and Strategy:
Entry Strategy:
• Aggressive Entry: ₹143-145 (current levels on any minor pullback)
• Conservative Entry: ₹135-138 (on retest of breakout level)
• Volume confirmation is required for any entry
Position Sizing:
• Risk 1-2% of portfolio capital on this trade
• Position size calculation: Portfolio Value × Risk % ÷ Stop Loss Distance
• Example: For ₹1,00,000 portfolio with 2% risk = ₹2,000 risk capital
Risk-Reward Calculation:
• Risk-Reward Ratio: Minimum 1:2 preferred
• Expected risk per share: ₹15-20 based on stop loss placement
• Potential reward: ₹30-40 per share to the first target
Exit Strategy:
Profit Targets:
• Target 1: ₹165-170 (15-20% upside) - Book 40% position
• Target 2: ₹185-190 (30-35% upside) - Book 40% position
• Target 3: ₹200+ (40 %+ upside) - Trail remaining 20% position
Stop Loss Levels:
• Initial Stop Loss: ₹125-128 (below consolidation support)
• Trailing Stop: Move to breakeven once Target 1 is achieved
• Final Trail: Use 10-day EMA or ₹10-15 trailing stop
Risk Management Framework:
Risk Control Measures:
• Maximum loss per trade: 2% of total capital
• Position sizing based on stop loss distance
• No averaging down if the trade goes against the initial thesis
• Exit if the technical structure breaks down
Portfolio Allocation:
• Maximum exposure to single stock: 5-8% of portfolio
• Sector allocation limit: 15-20% to logistics/supply chain
• Maintain diversification across market caps and sectors
Sectoral Analysis:
Logistics and Supply Chain Sector:
• The sector has shown resilience post-pandemic disruptions
• Growing e-commerce and digitalization are driving demand
• Government infrastructure push benefiting logistics companies
• Increasing focus on supply chain optimization across industries
Sector Positioning:
•
• Beneficiary of Make in India and manufacturing growth
• Automotive sector recovery supporting the company's core business
Fundamental Backdrop:
Business Overview:
• Leading third-party logistics and supply chain solutions provider
• Strong presence in automotive, consumer goods, and industrial sectors
• Integrated service offerings including warehousing, transportation, and value-added services
Growth Drivers:
• Expansion in new geographies and service offerings
• Technology-driven efficiency improvements
• Growing outsourcing trend in supply chain management
• Recovery in the automotive sector supporting traditional business
Market Outlook and Catalysts:
Positive Catalysts:
• New client acquisitions and contract wins
• Capacity expansion announcements
• Favourable government policies for the logistics sector
Risk Factors:
• Economic slowdown affecting industrial demand
• Fuel price volatility is impacting transportation costs
• Competitive pricing pressure in the logistics industry
• Global supply chain disruptions
My Take:
TVS Supply Chain Solutions presents a compelling technical setup with the recent breakout attempt from a multi-month consolidation. The combination of strong volume confirmation, supportive sectoral trends, and improving fundamental backdrop makes this an attractive opportunity for Short to medium-term investors. However, proper risk management and position sizing remain crucial for the successful execution of this trade setup.
Keep in the Watchlist.
NO RECO. For Buy/Sell.
📌Thank you for exploring my idea! I hope you found it valuable.
🙏FOLLOW for more
👍BOOST if you found it useful.
✍️COMMENT below with your views.
Meanwhile, check out my other stock ideas on the right side until this trade is activated. I would love your feedback.
Disclaimer: "I am not a SEBI REGISTERED RESEARCH ANALYST AND INVESTMENT ADVISER."
This analysis is intended solely for informational and educational purposes and should not be interpreted as financial advice. It is advisable to consult a qualified financial advisor or conduct thorough research before making investment decisions.
Penerbitan berkaitan
Penafian
Maklumat dan penerbitan adalah tidak bertujuan, dan tidak membentuk, nasihat atau cadangan kewangan, pelaburan, dagangan atau jenis lain yang diberikan atau disahkan oleh TradingView. Baca lebih dalam Terma Penggunaan.
Penerbitan berkaitan
Penafian
Maklumat dan penerbitan adalah tidak bertujuan, dan tidak membentuk, nasihat atau cadangan kewangan, pelaburan, dagangan atau jenis lain yang diberikan atau disahkan oleh TradingView. Baca lebih dalam Terma Penggunaan.