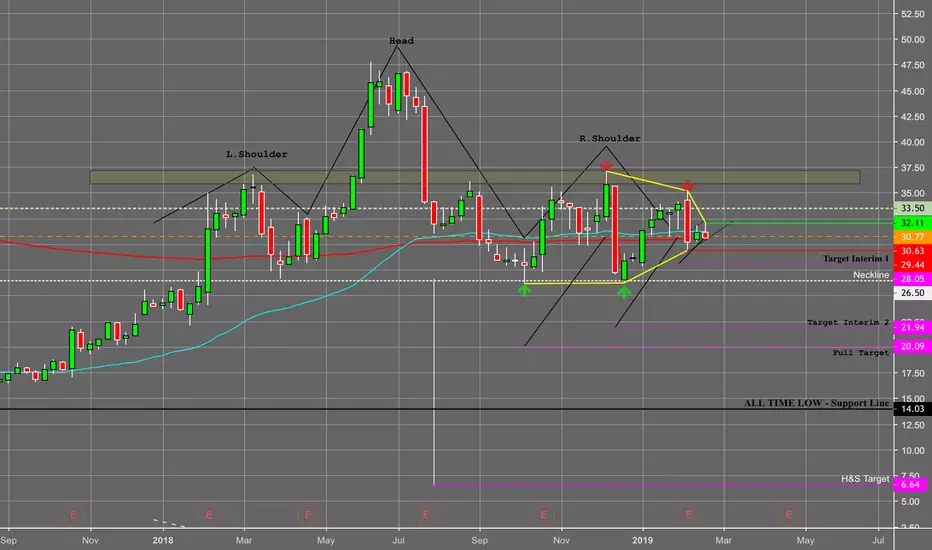
Twitter has been setting up a couple pretty strong bear patterns.
There is a nice forming H&S pattern with the right shoulder forming a low slung triangle pattern with the down-leg candles strong the the up-leg for the triangle and also the H&S pattern.
Moving averages has also decided to cross bearish with price action showing below it. The 100 EMA on the week looks to be the only support looking to support Twitter which happens to be around the red line drawn. Might have a little support from that. Once that breaks, no real strong support until
about $14 (All time low)
Possible short @ $29.44
Stop Loss $32.11
Taking most profit around Int 2.
Dagangan ditutup secara manual
This has negated the H&S theory I had for this trend and is showing strength. Tech sector looks fairly strongPenafian
Maklumat dan penerbitan adalah tidak dimaksudkan untuk menjadi, dan tidak membentuk, nasihat untuk kewangan, pelaburan, perdagangan dan jenis-jenis lain atau cadangan yang dibekalkan atau disahkan oleh TradingView. Baca dengan lebih lanjut di Terma Penggunaan.
Penafian
Maklumat dan penerbitan adalah tidak dimaksudkan untuk menjadi, dan tidak membentuk, nasihat untuk kewangan, pelaburan, perdagangan dan jenis-jenis lain atau cadangan yang dibekalkan atau disahkan oleh TradingView. Baca dengan lebih lanjut di Terma Penggunaan.
