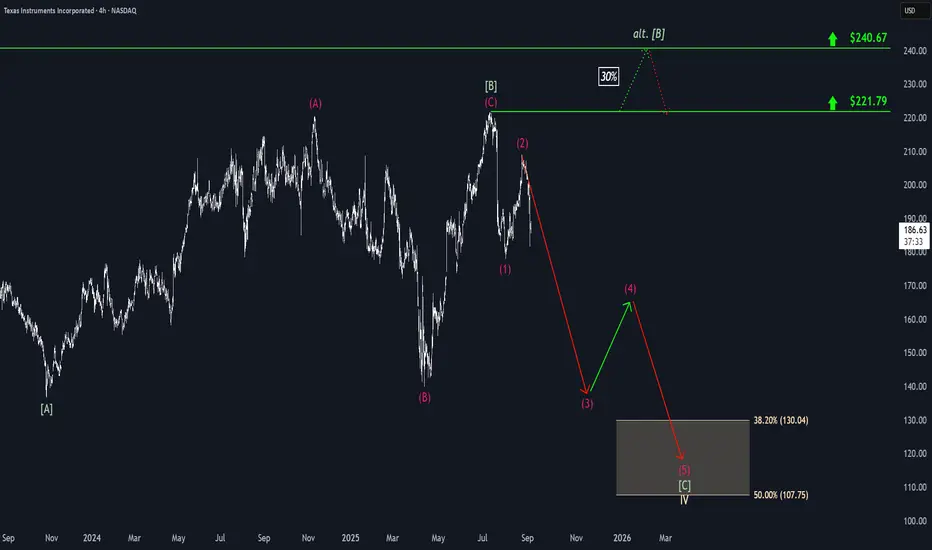
Texas Instruments has experienced sharp sell-offs, leading us to confirm the top of magenta wave (2). This suggests that the stock has completed the second stage of the ongoing magenta downward impulse. The current wave (3) still presents significant downside potential in the near term. After a brief recovery in wave (4), wave (5) is expected to reach our beige Target Zone between $130.04 and $107.75. A new corrective high in green wave alt.[B] above $221.79 could delay this process. However, in this 30% likely scenario, TXN should reverse course at the latest by the $240.67 level.
📊 Free daily market insights combining macro + Elliott Wave analysis
🚀 Spot trends early with momentum, sentiment & price structure
🌐 Join thousands trading smarter - full free analyses at dailymarketupdate.com
🚀 Spot trends early with momentum, sentiment & price structure
🌐 Join thousands trading smarter - full free analyses at dailymarketupdate.com
Penerbitan berkaitan
Penafian
Maklumat dan penerbitan adalah tidak dimaksudkan untuk menjadi, dan tidak membentuk, nasihat untuk kewangan, pelaburan, perdagangan dan jenis-jenis lain atau cadangan yang dibekalkan atau disahkan oleh TradingView. Baca dengan lebih lanjut di Terma Penggunaan.