Panjang
Short Term Bullish Idea _ US100 D1 _ 22-5-2022
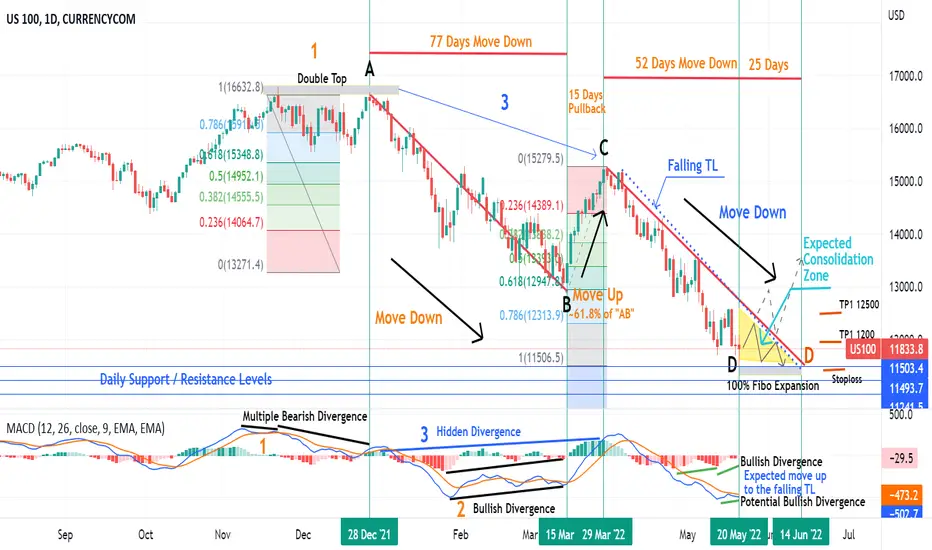
Analyzing US100 on daily time frame
1- Double Top coupled with Bearish Divergence resulted in a move down “AB” that lasted 77 days i.e from 28 December 2021 to 15 March 2022. Price dropped from 16800 to 12944 during that down move i.e almost 29% drop from A.
2- Bullish Divergence resulting in a pullback “BC” just shy of 61.8% Fibo. Retracement of the 1st Leg “AB” that completed in 15 days i.e from 15 March 2022 to 29 March 2022 with the formation of Bearish Hidden Divergence. During that period price recovered from 12944 to 15280 i.e almost 18% increase from B.
3- Bearish Hidden Divergence resulting in a move down “CD” that is on-going for the last 52 days i.e from 29 March 2022 to 20 May 2022. During that period price dropped from 15280 to 11495 i.e almost 33% drop from C.
a. The second leg “CD” has almost retraced to 100% Fibonacci Expansion level i.e 11505.
b. In terms of time cycle, 25 days still remain for the 2nd leg “CD” when compared to the time taken by the 1st leg “AB” for completion.
4- H4 - Piercing Bullish Candle and Potential Bullish Divergence.
5- HI – 3 White Solders and Potential Bullish Divergence.
All the above evidence suggests a short-term bullish move towards the falling trendline with Targets @ 12000 and 12500.
Protection is below the last low at point “D”.
If the price action manages to break the falling trendline then it can pullback between 38.2% - 50% Fibo. Retracement of the 2nd Leg “CD”.
Penafian
Maklumat dan penerbitan adalah tidak dimaksudkan untuk menjadi, dan tidak membentuk, nasihat untuk kewangan, pelaburan, perdagangan dan jenis-jenis lain atau cadangan yang dibekalkan atau disahkan oleh TradingView. Baca dengan lebih lanjut di Terma Penggunaan.
Penafian
Maklumat dan penerbitan adalah tidak dimaksudkan untuk menjadi, dan tidak membentuk, nasihat untuk kewangan, pelaburan, perdagangan dan jenis-jenis lain atau cadangan yang dibekalkan atau disahkan oleh TradingView. Baca dengan lebih lanjut di Terma Penggunaan.