Double Top Breakdown – US100 Short Setup (1H Chart)
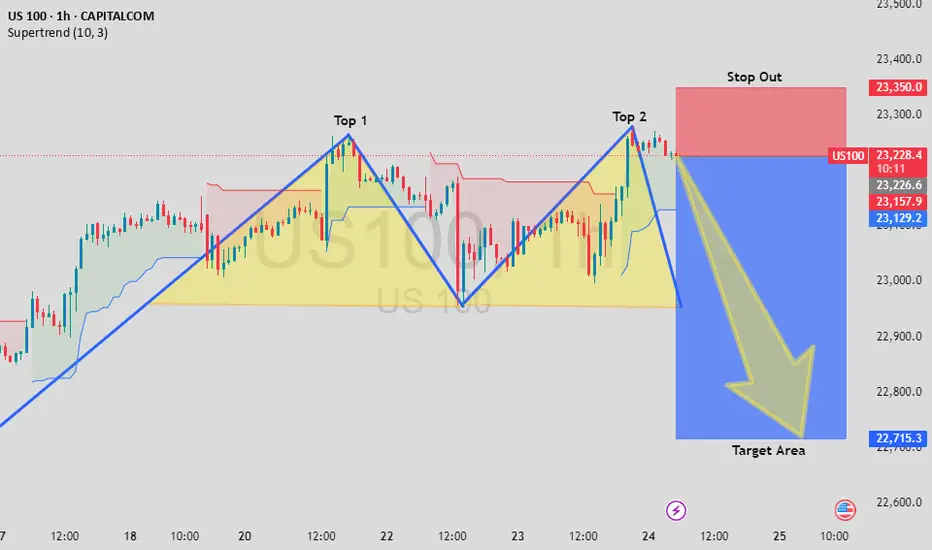
This US100 chart displays a clear Double Top pattern forming around the 23,300 level, signaling potential bearish reversal. After failing to break above the second peak (Top 2), price action has started to decline, confirming the pattern neckline break.
📉 Technical Highlights:
Double Top Formation confirmed with strong resistance at ~23,300.
Neckline support broken, indicating bearish momentum.
Supertrend indicator has flipped bearish.
Short entry around current levels (~23,200) with a Stop Loss at 23,350.
Target Area: ~22,715 based on measured move from pattern height.
📰 Fundamental Context:
Rising concerns over Fed's prolonged tight policy and slowing tech earnings could weigh on growth-sensitive indices like US100.
Upcoming economic data and earnings could add volatility, favoring downside pressure in the short term.
📌 Trade Idea: Short US100 below 23,230 with risk-reward favoring downside continuation.
Always use risk management and monitor fundamentals for sudden sentiment shifts.
Penafian
Maklumat dan penerbitan adalah tidak dimaksudkan untuk menjadi, dan tidak membentuk, nasihat untuk kewangan, pelaburan, perdagangan dan jenis-jenis lain atau cadangan yang dibekalkan atau disahkan oleh TradingView. Baca dengan lebih lanjut di Terma Penggunaan.
Penafian
Maklumat dan penerbitan adalah tidak dimaksudkan untuk menjadi, dan tidak membentuk, nasihat untuk kewangan, pelaburan, perdagangan dan jenis-jenis lain atau cadangan yang dibekalkan atau disahkan oleh TradingView. Baca dengan lebih lanjut di Terma Penggunaan.