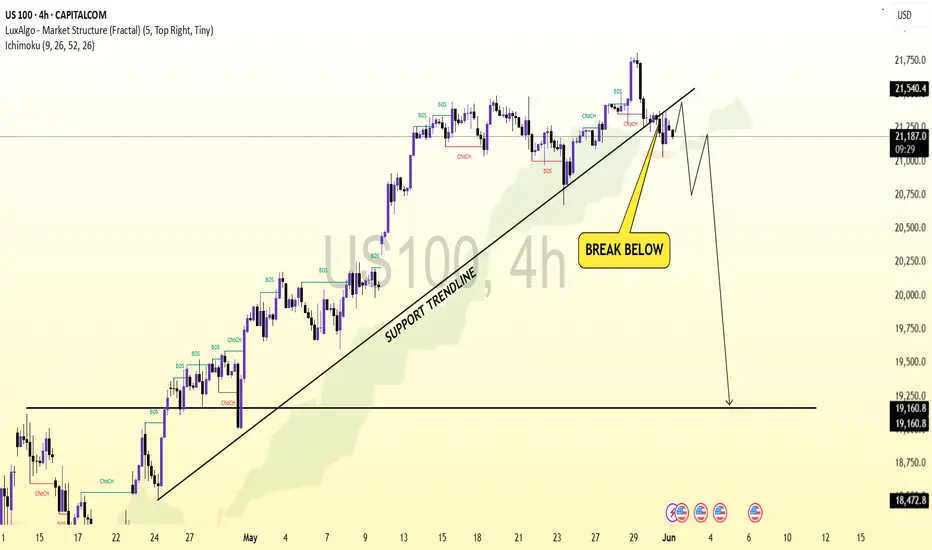
This 4-hour chart of the US100 (Nasdaq 100) shows a break below a long-standing ascending support trendline. The price has breached the trendline and is currently retesting the underside, suggesting a potential bearish reversal.
Key points:
The trendline break signals a possible end to the previous bullish momentum.
A retest of the broken support turned resistance is in progress.
If the price fails to reclaim the trendline, a deeper drop toward the 19,160 and 18,472 levels is likely.
The projected path indicates a short-term bounce followed by a significant bearish move.
Overall, the chart suggests bearish sentiment unless buyers reclaim and hold above the broken trendline.
Penafian
Maklumat dan penerbitan adalah tidak dimaksudkan untuk menjadi, dan tidak membentuk, nasihat untuk kewangan, pelaburan, perdagangan dan jenis-jenis lain atau cadangan yang dibekalkan atau disahkan oleh TradingView. Baca dengan lebih lanjut di Terma Penggunaan.
Penafian
Maklumat dan penerbitan adalah tidak dimaksudkan untuk menjadi, dan tidak membentuk, nasihat untuk kewangan, pelaburan, perdagangan dan jenis-jenis lain atau cadangan yang dibekalkan atau disahkan oleh TradingView. Baca dengan lebih lanjut di Terma Penggunaan.