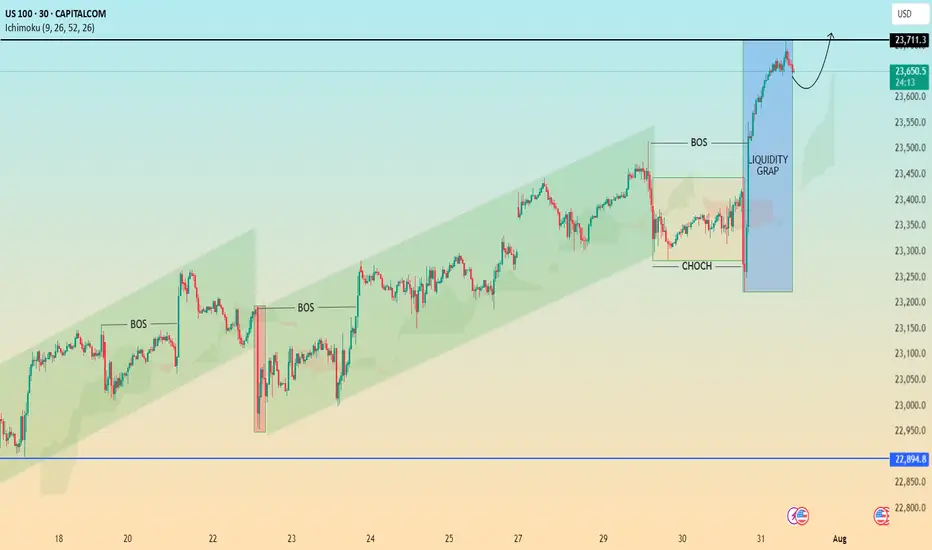
US100 (Nasdaq) Price Action Breakdown – July 31, 2025
🧩 Technical Analysis Summary:
📌 Market Structure:
Bullish Structure: The chart has maintained a consistent bullish channel across multiple sessions, confirmed by higher highs and higher lows.
Break of Structure (BOS): Multiple BOS points indicate strength in upward moves and validation of bullish trend continuation.
CHoCH (Change of Character): Temporary bearish shift occurred, but the market quickly reclaimed the range and broke out strongly.
💧 Liquidity Grab:
A sharp wick to the downside near the CHoCH created a liquidity sweep, shaking out weak longs before a powerful bullish impulse.
The liquidity zone acted as a springboard for the current upward breakout.
🔵 Current Price Action:
The market is currently in a post-breakout retracement phase, potentially setting up for continuation toward the 23,800–24,000 level.
Price has tapped into a minor resistance and is consolidating slightly, forming a bullish flag or pennant setup.
🔮 Potential Scenarios:
✅ Scenario 1: Bullish Continuation
If price respects current short-term support (~23,630–23,650), expect a breakout above 23,711.3 and extension to next major liquidity zone.
Momentum remains bullish with strong volume and prior imbalance now filled.
⚠️ Scenario 2: Deeper Pullback
If price fails to hold above the breakout zone, we could see a retest toward the top of the CHoCH zone (~23,400), before continuing higher.
Dagangan aktif
Penafian
Maklumat dan penerbitan adalah tidak dimaksudkan untuk menjadi, dan tidak membentuk, nasihat untuk kewangan, pelaburan, perdagangan dan jenis-jenis lain atau cadangan yang dibekalkan atau disahkan oleh TradingView. Baca dengan lebih lanjut di Terma Penggunaan.
Penafian
Maklumat dan penerbitan adalah tidak dimaksudkan untuk menjadi, dan tidak membentuk, nasihat untuk kewangan, pelaburan, perdagangan dan jenis-jenis lain atau cadangan yang dibekalkan atau disahkan oleh TradingView. Baca dengan lebih lanjut di Terma Penggunaan.
