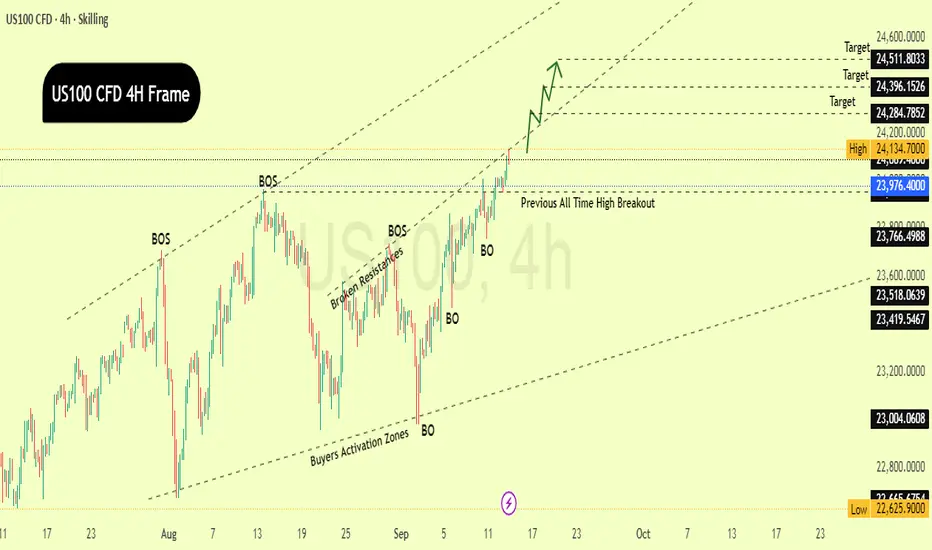
This 4-hour chart of the US100 (Nasdaq) shows a strong bullish trend supported by multiple breakouts (BO) and break of structure (BOS) signals over the past few weeks. After retesting and bouncing from key buyer activation zones, the price has consistently broken through previous resistance levels.
Most notably, the index has just broken above its previous all-time high around 23,976, signaling strong momentum and potential for further upside. The price is currently hovering near 24,089, with key short-term targets marked at:
Target : $24,284
Target : $24,396
Target : $24,511
These targets align with the upper boundary of a rising parallel channel, suggesting the bulls are in control for now.
The chart projects a continuation of this bullish move, with a stair-step rally expected if the current breakout holds. As long as the price stays above the breakout zone and respects the structure, the upside targets remain in play.
In short: US100 is showing solid bullish strength, breaking above its previous highs with clear upside potential.
Educational Idea.
Dagangan aktif
According to published suggestion and setup given , Price moved in favor of the trend , Almost it is approaching 1st target that was ,24271, Price currently moving at 24262.Nota
One out of three targets on my US100 CFD 4H chart has been successfully hit Additionally, the market touched my second target and came back.Now I'm working on my next strategy.Dagangan ditutup: sasaran tercapai
Price After hitting my last destination Target that was $24537 Printed new high $24635 formed, Small rejection is loading , Lets see what will happens next to this. We will wait for confirmatio.Penafian
Maklumat dan penerbitan adalah tidak dimaksudkan untuk menjadi, dan tidak membentuk, nasihat untuk kewangan, pelaburan, perdagangan dan jenis-jenis lain atau cadangan yang dibekalkan atau disahkan oleh TradingView. Baca dengan lebih lanjut di Terma Penggunaan.
Penafian
Maklumat dan penerbitan adalah tidak dimaksudkan untuk menjadi, dan tidak membentuk, nasihat untuk kewangan, pelaburan, perdagangan dan jenis-jenis lain atau cadangan yang dibekalkan atau disahkan oleh TradingView. Baca dengan lebih lanjut di Terma Penggunaan.