So many people I follow on X are very bearish the longer term bond cycle...claiming that the years of declining rates are over and that we are now in a new cycle of rising rates over the next 40-50 years. Even I have been a proponent of that language; writing up an idea on 3/31/2022 when rates were 2.326 and rising. But now it seems everyone is on that side of the boat which makes the contrarian view worth a look. Are longer term bonds really that bad of a buy right now?
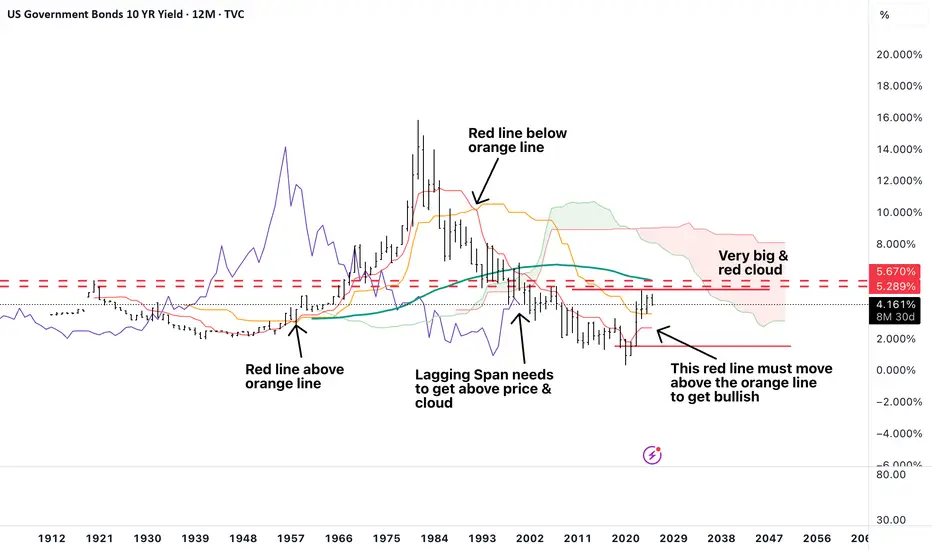
I decided to look at it from a simplistic Ichimoku point of view...using a yearly bar chart. Yes a really, really long term chart because if we are talking about the next 40-50 years then it's worth looking at a very, very long term chart.
However when looking at this long term Ichimoku chart; nothing about this chart suggests we are in a new cycle. In fact, nothing about this chart is bullish rising rates and you would just be trying to call a bottom out of thin air.
One of the first indications of a change in sentiment for Ichimoku is getting the Tenkan Sen (red line) to cross over the Kijun Sen (orange line). Even with the strength in rates over the following 5 years we are no where close to getting a cross over of those two lines to occur. In addition, the lagging span (purple line) is still below price and the cloud and the cloud is still hugely red.
In short, nothing about this chart screams longer term bonds are a bad buy...getting the 10 year rate chart to move from bearish (where it stands now) to bullish in the very long term will in fact be a fairly large task IMO.
Therefore, I am following the projection of the red & orange lines and right now they are suggesting a "flattening" out period...perhaps these two lines move closer over the next 10-15 years and then something occurs to spike rates and causes the red line to cross over the orange but until then people are just calling a bottom.
Basically rates would need to spike again this year or next to well over 6% to get the lagging span above price & the cloud and to cause the red line to move to an upwards trend...then and only then would I change my above stance.
Nota
After my recent post about the possibility that rates could hover around 8% should the monthly line chart showing a bull flag in the making break to the upside I am watching this one like a hawk. 5% rates aren't bad but should that bull flag break upwards you would not want to continue holding bonds at the 5% level. Penafian
Maklumat dan penerbitan adalah tidak dimaksudkan untuk menjadi, dan tidak membentuk, nasihat untuk kewangan, pelaburan, perdagangan dan jenis-jenis lain atau cadangan yang dibekalkan atau disahkan oleh TradingView. Baca dengan lebih lanjut di Terma Penggunaan.
Penafian
Maklumat dan penerbitan adalah tidak dimaksudkan untuk menjadi, dan tidak membentuk, nasihat untuk kewangan, pelaburan, perdagangan dan jenis-jenis lain atau cadangan yang dibekalkan atau disahkan oleh TradingView. Baca dengan lebih lanjut di Terma Penggunaan.