US 10Y Yield – Wave 4 Pause Before the Final Surge
Disclaimer: This analysis is for educational purposes only and does not constitute investment advice. Please do your own research (DYOR) before making any trading decisions.
The Setup
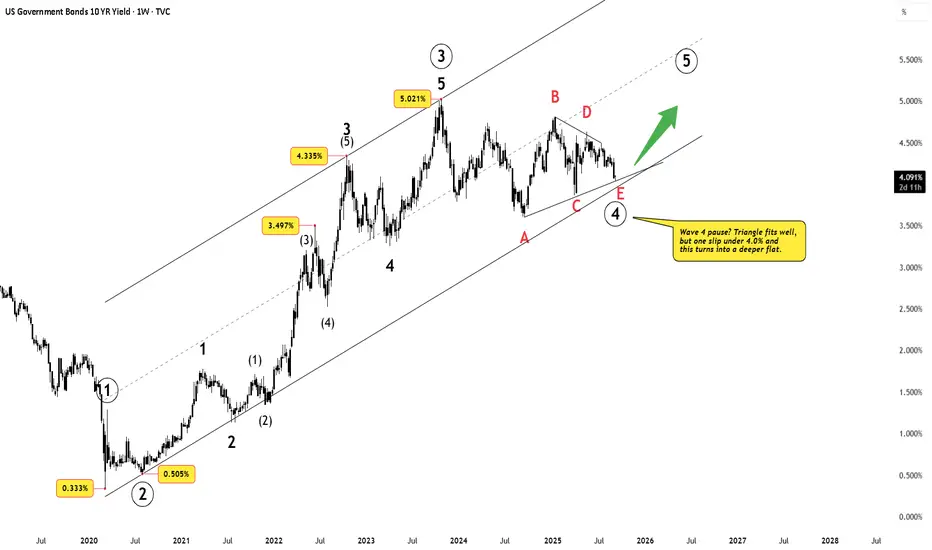
The US 10-year yield has been consolidating after topping near 5.021%. Price action since then has formed a contracting structure that looks very much like a Wave 4 triangle.
At present, yields hover near 4.0% — a crucial pivot.
Either way, the Elliott script points to one more advance: Wave 5 up.
What Wave 5 Could Mean
If the US 10-year yield really enters Wave ⑤ up, buckle up:
In short: Wave ⑤ = a macro “stress test.”
Why India Should Care
A breakout in US yields rarely stays a US-only story. For India, it means:
Final Thoughts
The triangle scenario points to an imminent breakout above 5.0%. A deeper flat only delays it. For traders and investors, this is the chart to watch — because Wave 5 in US yields isn’t just a bond market story, it’s a global macro shockwave.
The Setup
The US 10-year yield has been consolidating after topping near 5.021%. Price action since then has formed a contracting structure that looks very much like a Wave 4 triangle.
At present, yields hover near 4.0% — a crucial pivot.
- Triangle view: Wave 4 is complete, setting the stage for Wave 5 higher.
- Flat view: If yields break below 4.0%, Wave 4 may stretch deeper into a flat correction, potentially testing 3.6–3.7%.
Either way, the Elliott script points to one more advance: Wave 5 up.
What Wave 5 Could Mean
If the US 10-year yield really enters Wave ⑤ up, buckle up:
- Bond prices tank → inverse relation, so Treasuries bleed.
- Equities feel the heat → higher yields = expensive valuations, especially for growth stocks.
- Dollar flexes → global FX could see USD strength.
- Borrowing costs bite → mortgages, corporate loans, government debt servicing all tighten.
In short: Wave ⑤ = a macro “stress test.”
Why India Should Care
A breakout in US yields rarely stays a US-only story. For India, it means:
- FII outflows as global funds chase safer US returns
- INR under pressure, increasing imported inflation risks
- Indian bond yields rising, even without RBI action
- Equity market stress, especially in IT and rate-sensitive sectors
Final Thoughts
The triangle scenario points to an imminent breakout above 5.0%. A deeper flat only delays it. For traders and investors, this is the chart to watch — because Wave 5 in US yields isn’t just a bond market story, it’s a global macro shockwave.
WaveXplorer | Elliott Wave insights
📊 X profile: @veerappa89
📊 X profile: @veerappa89
Penafian
Maklumat dan penerbitan adalah tidak dimaksudkan untuk menjadi, dan tidak membentuk, nasihat untuk kewangan, pelaburan, perdagangan dan jenis-jenis lain atau cadangan yang dibekalkan atau disahkan oleh TradingView. Baca dengan lebih lanjut di Terma Penggunaan.