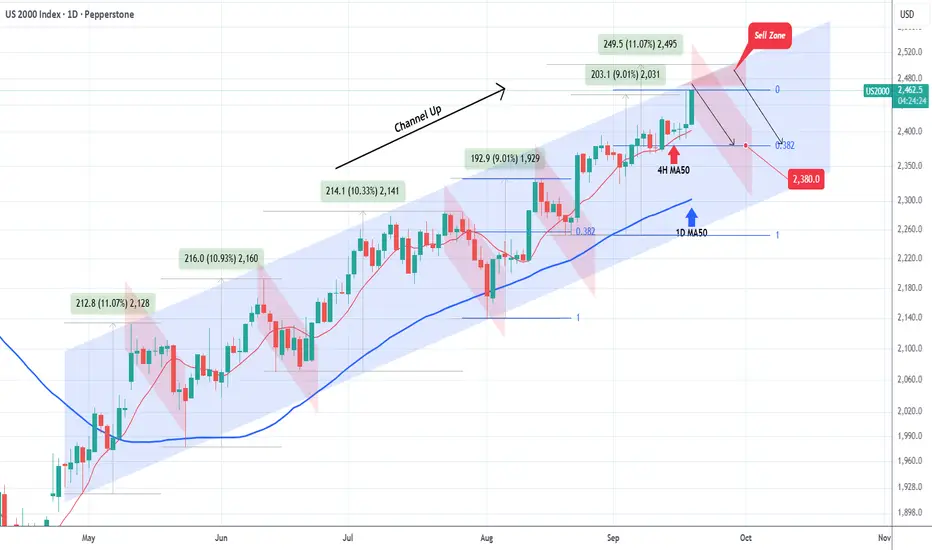
Russell 2000 (RUT) has been trading within a Channel Up since late April and right now its current Bullish Leg is about to test the pattern's top (Higher Highs trend-line).
It has completed a +9.01% rise from the August 20 Low, which is the same increase of the previous (August 01 - 13) Bullish Leg and that has been the 'weakest' one out of all Legs of the Channel Up (+11.07%, +10.93% and +10.33% the others).
As a result, we can start thinking about taking profits on this run and an upcoming new pull-back (red Bearish Leg/ Channel Down) within a Sell Zone that extends up to +11.07% (2500).
Within this Zone, any rejection we get, we are targeting 2380, which is the 0.382 Fibonacci retracement level applied on the minimum +9.01% rally.
-------------------------------------------------------------------------------
** Please LIKE 👍, FOLLOW ✅, SHARE 🙌 and COMMENT ✍ if you enjoy this idea! Also share your ideas and charts in the comments section below! This is best way to keep it relevant, support us, keep the content here free and allow the idea to reach as many people as possible. **
-------------------------------------------------------------------------------
💸💸💸💸💸💸
👇 👇 👇 👇 👇 👇
👑Best Signals (Forex/Crypto+70% accuracy) & Account Management (+20% profit/month on 10k accounts)
💰Free Channel t.me/tradingshotglobal
🤵Contact info@tradingshot.com t.me/tradingshot
🔥New service: next X100 crypto GEMS!
💰Free Channel t.me/tradingshotglobal
🤵Contact info@tradingshot.com t.me/tradingshot
🔥New service: next X100 crypto GEMS!
Penafian
Maklumat dan penerbitan adalah tidak dimaksudkan untuk menjadi, dan tidak membentuk, nasihat untuk kewangan, pelaburan, perdagangan dan jenis-jenis lain atau cadangan yang dibekalkan atau disahkan oleh TradingView. Baca dengan lebih lanjut di Terma Penggunaan.