TECHNICAL AND FUNDAMENTAL ANALYSIS FOR LONG
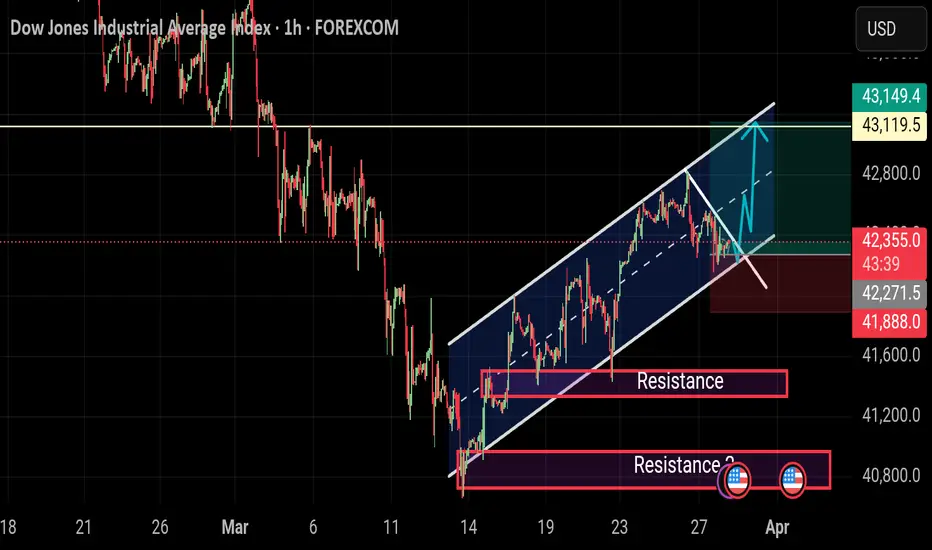
Buying US30 from 42,300 to 42,200 with a target of 43,100 appears to be a bullish strategy. To justify this move, let's break down the fundamental analysis.
*Market Trend*
The Dow Jones Industrial Average (US30) has been on an upward trend, with a 13.7% increase over the last six months ¹. This suggests a strong bullish momentum.
*Technical Indicators*
- *MACD (Moving Average Convergence Divergence)*: Although the MACD lines remain in bullish territory, the histogram has started to tick lower, indicating a potential weakening of the bullish momentum ¹.
- *RSI (Relative Strength Index)*: The RSI is approaching overbought territory, a level often associated with trend exhaustion ¹.
*Economic Factors*
- *Strong Labor Market*: The US labor market has shown resilience, with strong payroll data and wages growing at 4% ².
- *Interest Rates*: The Federal Reserve's interest rate decisions will impact the US30. A rate cut could boost the index, while a rate hike might lead to a correction ².
*Trading Strategy*
Given the bullish trend and strong labor market, buying US30 from 42,300 to 42,200 with a target of 43,100 seems reasonable. However, keep a close eye on technical indicators and economic factors, as they can impact the index's movement.
*Risk Management*
- *Stop-Loss*: Set a stop-loss at 42,000 to limit potential losses.
- *Position Sizing*: Manage your position size to maintain a risk-reward ratio of 1:1.5.
By considering both technical and fundamental analysis, you can make an informed decision about your trading strategy.
Keep your best wishes to the Travis 👍
Dagangan ditutup: hentian tercapai
Penerbitan berkaitan
Penafian
Maklumat dan penerbitan adalah tidak bertujuan, dan tidak membentuk, nasihat atau cadangan kewangan, pelaburan, dagangan atau jenis lain yang diberikan atau disahkan oleh TradingView. Baca lebih dalam Terma Penggunaan.
Penerbitan berkaitan
Penafian
Maklumat dan penerbitan adalah tidak bertujuan, dan tidak membentuk, nasihat atau cadangan kewangan, pelaburan, dagangan atau jenis lain yang diberikan atau disahkan oleh TradingView. Baca lebih dalam Terma Penggunaan.