Dow Jones Industrial Average Index - 4h Chart (FOREXCOM)
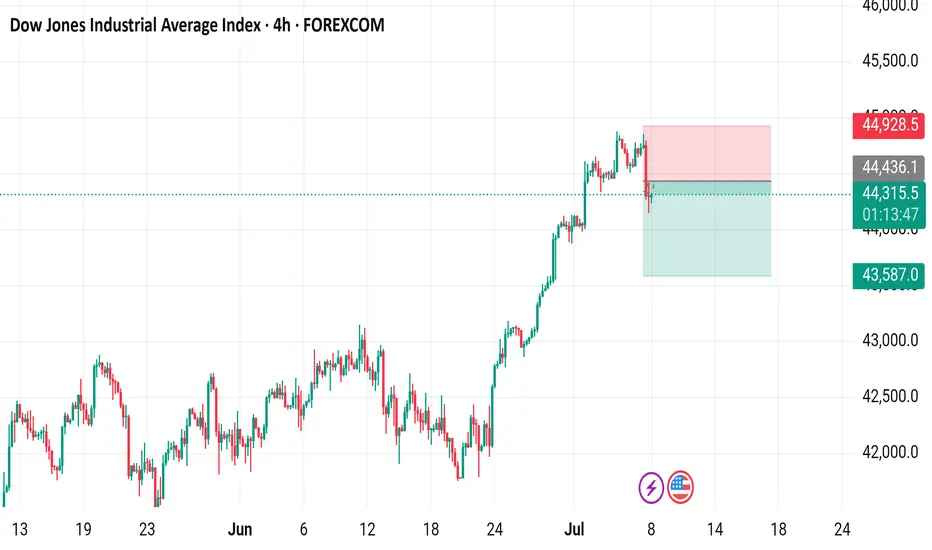
4-hour candlestick chart of the Dow Jones Industrial Average Index (US30) showing the price movement from late June to early July 2025. The current price is 44,314.0, with a slight increase of +23.0 (+0.05%). The chart includes buy and sell signals at 44,316.5 and 44,310.5 respectively, with highlighted resistance and support zones. The index has shown a general upward trend with some volatility over the period.
Dagangan ditutup secara manual
Target achieved on $44,148 it's a very long directions so close full now don't hold guy'sPenafian
Maklumat dan penerbitan adalah tidak bertujuan, dan tidak membentuk, nasihat atau cadangan kewangan, pelaburan, dagangan atau jenis lain yang diberikan atau disahkan oleh TradingView. Baca lebih dalam Terma Penggunaan.
Penafian
Maklumat dan penerbitan adalah tidak bertujuan, dan tidak membentuk, nasihat atau cadangan kewangan, pelaburan, dagangan atau jenis lain yang diberikan atau disahkan oleh TradingView. Baca lebih dalam Terma Penggunaan.