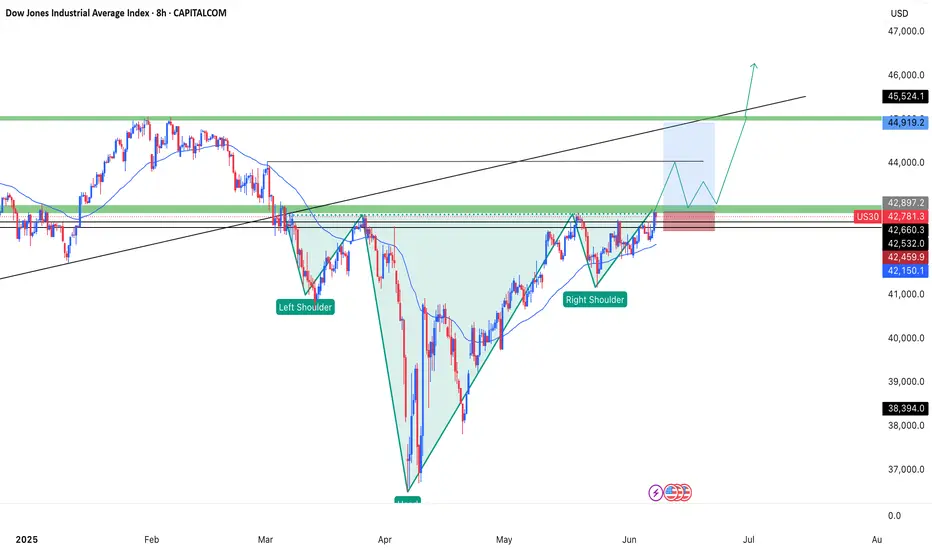
Based on the Dow Jones Industrial Average (US30) chart as of June 8, 2025, here is a brief technical analysis to assess a buy or sell position:
Key Observations:
Current Price: 42,781.3 (closing price), down -0.23% for the day.
Technical Levels:
Nearby Resistance: 42,888.0 (daily high) and 43,324.1 (intermediate level).
Immediate Support: 42,532.9 (lower level) and 42,150.1 (key support).
Psychological Levels: 43,000 (resistance) and 42,000 (support).
Overall Trend:
The price is trading in a range between 42,150.1 and 43,324.1, with slight recent downward pressure.
Moving averages or other indicators are not visible on this chart, but the volume (63.24K) appears moderate.
Possible Scenarios:
Buy (Long):
If the price bounces from support at 42,532.9 or 42,150.1 with increasing volume, a rebound toward 43,000 is possible.
A breakout above 42,888.0 (daily high) could confirm bullish momentum.
Sell (Short):
If the price breaks below 42,150.1, it could open the door to 41,000.0 (major support).
The weak daily performance (-0.23%) and failure to sustain gains might indicate temporary weakness.
Recommendation:
Wait for Confirmation:
For a buy, watch for a bounce from the mentioned support levels with rising volume.
For a sell, wait for a clear breakdown below 42,150.1.
Risk Management: Place a stop-loss below 42,000 for a buy or above 43,000 for a sell.
Note: Without additional technical indicators (RSI, MACD, etc.), this analysis is based on visible price levels. Use other tools to refine your strategy.
📌 Prioritize trades aligned with the overall trend (currently neutral to slightly bearish on this timeframe).
Let me know if you'd like any further refinements!
Penafian
Maklumat dan penerbitan adalah tidak dimaksudkan untuk menjadi, dan tidak membentuk, nasihat untuk kewangan, pelaburan, perdagangan dan jenis-jenis lain atau cadangan yang dibekalkan atau disahkan oleh TradingView. Baca dengan lebih lanjut di Terma Penggunaan.
Penafian
Maklumat dan penerbitan adalah tidak dimaksudkan untuk menjadi, dan tidak membentuk, nasihat untuk kewangan, pelaburan, perdagangan dan jenis-jenis lain atau cadangan yang dibekalkan atau disahkan oleh TradingView. Baca dengan lebih lanjut di Terma Penggunaan.