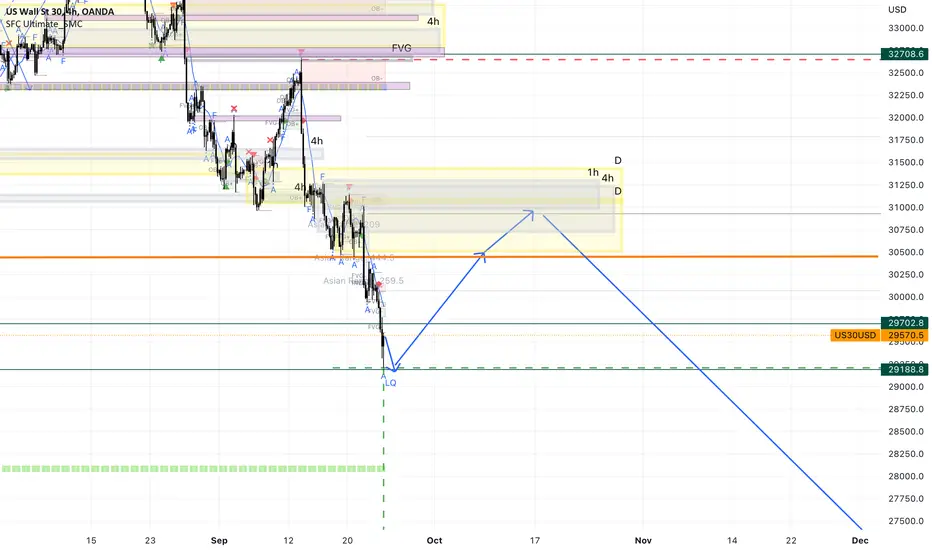
Last week price reached an area of support and we saw a rejection. I am expecting price to go down and form a double bottom or clear the liquidity from this bottom, before the real retracement. This week we may see some profit taking and price to go up. Buying this asset is very risky in my opinion, that is why waiting for the pullback will be the better choice. Price can form another consolidation instead of Pullback.
As usual important levels are marked based on Manipulation strategy.
Fundamentally I am very very bearish on US30 and you can see why from the link below:

SnR Chart

From this chart we can see, that last week price broke the consolidation, it is expected from price to go back and test this area. In my opinion price will form a double bottom or wedge before retracement. The important levels are marked based on Support and Resistance area, Fibonacci numbers and weekly pivot points.
Indicators

From this chart we can see, that US30 is oversold and need some retracement to come back in normal state - somewhere in Moving Averages area. Momentum is very bearish, but RSI made a divergence.
Correlation


At this time there is no SMT divergence.
From the first chart, we can see the COT Positions. From the long-term chart, seems that the big players reached a very strong support zone and we will see at least a reaction here. From the short-term chart, I see that last week the traders were bullish. This make me think, that soon price will go up too.
As usual important levels are marked based on Manipulation strategy.
Fundamentally I am very very bearish on US30 and you can see why from the link below:
SnR Chart
From this chart we can see, that last week price broke the consolidation, it is expected from price to go back and test this area. In my opinion price will form a double bottom or wedge before retracement. The important levels are marked based on Support and Resistance area, Fibonacci numbers and weekly pivot points.
Indicators
From this chart we can see, that US30 is oversold and need some retracement to come back in normal state - somewhere in Moving Averages area. Momentum is very bearish, but RSI made a divergence.
Correlation
At this time there is no SMT divergence.
From the first chart, we can see the COT Positions. From the long-term chart, seems that the big players reached a very strong support zone and we will see at least a reaction here. From the short-term chart, I see that last week the traders were bullish. This make me think, that soon price will go up too.
Penafian
Maklumat dan penerbitan adalah tidak dimaksudkan untuk menjadi, dan tidak membentuk, nasihat untuk kewangan, pelaburan, perdagangan dan jenis-jenis lain atau cadangan yang dibekalkan atau disahkan oleh TradingView. Baca dengan lebih lanjut di Terma Penggunaan.
Penafian
Maklumat dan penerbitan adalah tidak dimaksudkan untuk menjadi, dan tidak membentuk, nasihat untuk kewangan, pelaburan, perdagangan dan jenis-jenis lain atau cadangan yang dibekalkan atau disahkan oleh TradingView. Baca dengan lebih lanjut di Terma Penggunaan.