We have seen mixed price action for the last four days, with rallies finding sellers and dips finding buyers
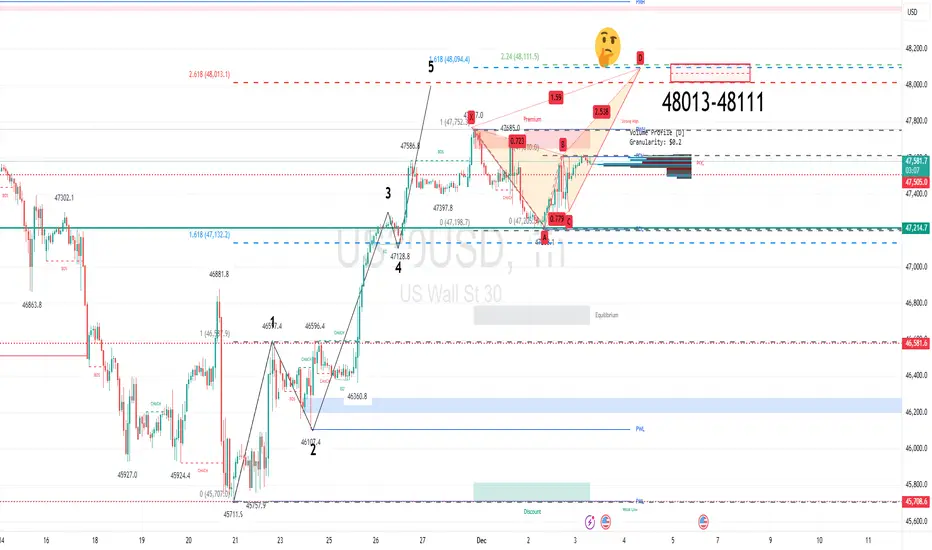
The intraday chart highlights a 261.8% extension level at 48,013. A move to this zone would be analysed as the completion of a bullish 5 Wave count (Elliott Wave).
The current mixed daily results look to be forming a Crab pattern. That will be completed on a move to 48,111.
Conclusion: the medium-term bias is bearish. The preferred stance would be to sell into rallies within the 48,013-48,111 zone.
Please ask me for a current Discord link
Penafian
Maklumat dan penerbitan adalah tidak bertujuan, dan tidak membentuk, nasihat atau cadangan kewangan, pelaburan, dagangan atau jenis lain yang diberikan atau disahkan oleh TradingView. Baca lebih dalam Terma Penggunaan.
Please ask me for a current Discord link
Penafian
Maklumat dan penerbitan adalah tidak bertujuan, dan tidak membentuk, nasihat atau cadangan kewangan, pelaburan, dagangan atau jenis lain yang diberikan atau disahkan oleh TradingView. Baca lebih dalam Terma Penggunaan.