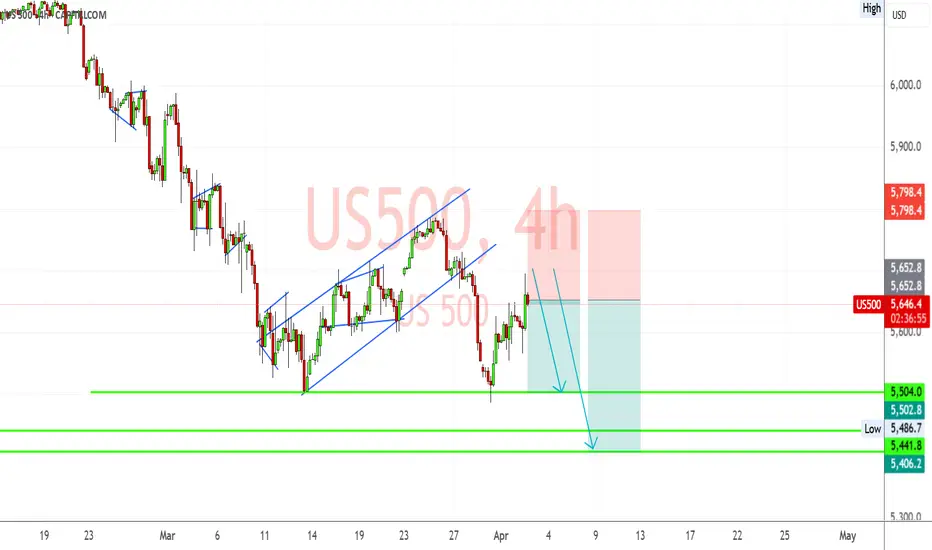
This analysis focuses on the US500 chart, a representation of the S&P 500 index, a key indicator of the US stock market's performance. The chart displays price action over a 4-hour timeframe, offering a medium-term perspective. The analysis aims to identify potential support levels and assess the likelihood of further bearish movement.
2. Key Findings and Supporting Evidence:
Bearish Trend: The chart clearly shows a prevailing downtrend. The price has been making lower highs and lower lows, signifying strong selling pressure.
Breakdown of Rising Wedge: A rising wedge pattern, often considered a bearish reversal pattern, is visible between March 11th and March 27th. The subsequent breakdown from this wedge has confirmed the bearish sentiment and suggests a continuation of the downtrend.
Potential Support Levels: The chart highlights three potential support levels:
5500 (Current Level): The price is currently hovering around this level. A break below this level could trigger further selling.
5504.2 (First Target): This level is marked as the first potential target for the bearish move.
5441.3 (Second Target): This level represents a more significant support and a deeper potential target.
Trading Strategy Indication: The chart suggests a potential short-selling opportunity, with entry around the current level (5500) and targets at the identified support levels. The stop-loss is placed above the recent high to manage risk.
High Volatility: The sharp price swings and the length of the red (bearish) candles indicate high volatility, suggesting strong momentum behind the downtrend.
3. Relevant Data and Statistics (Inferred):
Timeframe: 4-hour chart.
Index: US500 (S&P 500 equivalent).
Recent High: Approximately 5800.
Recent Low: Approximately 5486.7.
Potential Support Levels: 5500, 5504.2, 5441.3.
4. Discussion of Implications and Potential Future Trends:
Market Sentiment: The breakdown from the rising wedge and the continued bearish momentum suggest a shift in market sentiment towards increased pessimism.
Economic Factors: The downtrend could be influenced by various economic factors, such as rising interest rates, inflation concerns, or geopolitical uncertainties.
Risk Management: Traders should exercise caution and implement proper risk management strategies, including stop-loss orders, due to the high volatility.
Potential for Rebound: While the current trend is bearish, it's essential to acknowledge the possibility of a rebound or consolidation at the support levels.
📊 Forex Signals | Free Daily Alerts
✅ 85% Accuracy | 1–2 Signals/Day
💰 Profitable Trades Sent Daily – No Cost
📲 Join Us on Telegram
t.me/ultreos_forex
🎯 Upgrade to VIP:
ultreosforex.com/
✅ 85% Accuracy | 1–2 Signals/Day
💰 Profitable Trades Sent Daily – No Cost
📲 Join Us on Telegram
t.me/ultreos_forex
🎯 Upgrade to VIP:
ultreosforex.com/
Penafian
Maklumat dan penerbitan adalah tidak dimaksudkan untuk menjadi, dan tidak membentuk, nasihat untuk kewangan, pelaburan, perdagangan dan jenis-jenis lain atau cadangan yang dibekalkan atau disahkan oleh TradingView. Baca dengan lebih lanjut di Terma Penggunaan.
