Hello Traders, I hope you’ve all had a profitable week!
🧐 Market overview:
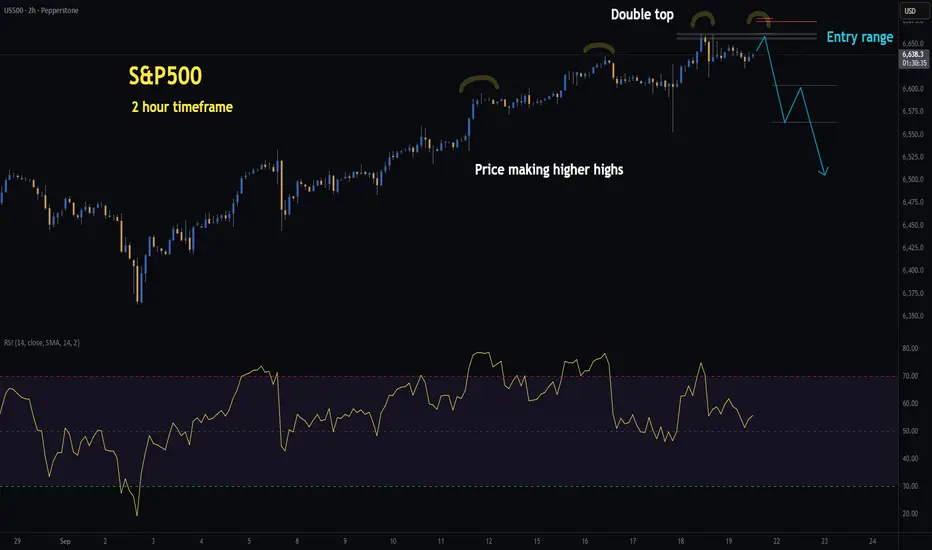
The US500 has pushed into new highs since the FOMC and remains in an uptrend. However, price is advancing on weakening momentum — higher highs in price while RSI prints lower highs, a classic case of negative divergence. My system is flagging this as a potential double top setup on the 2H timeframe, but I am still waiting for confirmation before entering a short.
Interestingly, while my system highlights bearish risk, there are also bullish signals worth noting:
- Daily CMF money flow shows no negative divergence.
- Daily MACD remains on a buy signal.
- The recent rate cut adds further liquidity and stimulus to markets.
📊 My trade plan:
Risk/Reward: 3.6 – 4.5
Entry: 6,655.6 – 6,661.8
Stop Loss: 6,674.8 – 6,678.6
Take Profit 1 (50%): 6,604
Take Profit 2 (50%): 6,563
The entry and stop ranges vary depending on where the setup confirms within the zone.
Tip:
Divergences often act as early warning signs of trend exhaustion, but they work best when combined with pattern confirmation (like a double top) rather than traded in isolation.
🙏 Thanks for checking out my post!
Make sure to follow me to catch the next idea and keen to hear if you are trading the US500? :)
Please note: This is not financial advice. This content is to track my trading journey and for educational purposes only.
🧐 Market overview:
The US500 has pushed into new highs since the FOMC and remains in an uptrend. However, price is advancing on weakening momentum — higher highs in price while RSI prints lower highs, a classic case of negative divergence. My system is flagging this as a potential double top setup on the 2H timeframe, but I am still waiting for confirmation before entering a short.
Interestingly, while my system highlights bearish risk, there are also bullish signals worth noting:
- Daily CMF money flow shows no negative divergence.
- Daily MACD remains on a buy signal.
- The recent rate cut adds further liquidity and stimulus to markets.
📊 My trade plan:
Risk/Reward: 3.6 – 4.5
Entry: 6,655.6 – 6,661.8
Stop Loss: 6,674.8 – 6,678.6
Take Profit 1 (50%): 6,604
Take Profit 2 (50%): 6,563
The entry and stop ranges vary depending on where the setup confirms within the zone.
Tip:
Divergences often act as early warning signs of trend exhaustion, but they work best when combined with pattern confirmation (like a double top) rather than traded in isolation.
🙏 Thanks for checking out my post!
Make sure to follow me to catch the next idea and keen to hear if you are trading the US500? :)
Please note: This is not financial advice. This content is to track my trading journey and for educational purposes only.
Dagangan aktif
Patience has paid off. All systems go.Short opened at 6 654.7. SL at 6 678.7.
Dagangan ditutup: hentian tercapai
Max loss taken. Stop loss hit.Time to reset
Penafian
Maklumat dan penerbitan adalah tidak dimaksudkan untuk menjadi, dan tidak membentuk, nasihat untuk kewangan, pelaburan, perdagangan dan jenis-jenis lain atau cadangan yang dibekalkan atau disahkan oleh TradingView. Baca dengan lebih lanjut di Terma Penggunaan.
Penafian
Maklumat dan penerbitan adalah tidak dimaksudkan untuk menjadi, dan tidak membentuk, nasihat untuk kewangan, pelaburan, perdagangan dan jenis-jenis lain atau cadangan yang dibekalkan atau disahkan oleh TradingView. Baca dengan lebih lanjut di Terma Penggunaan.