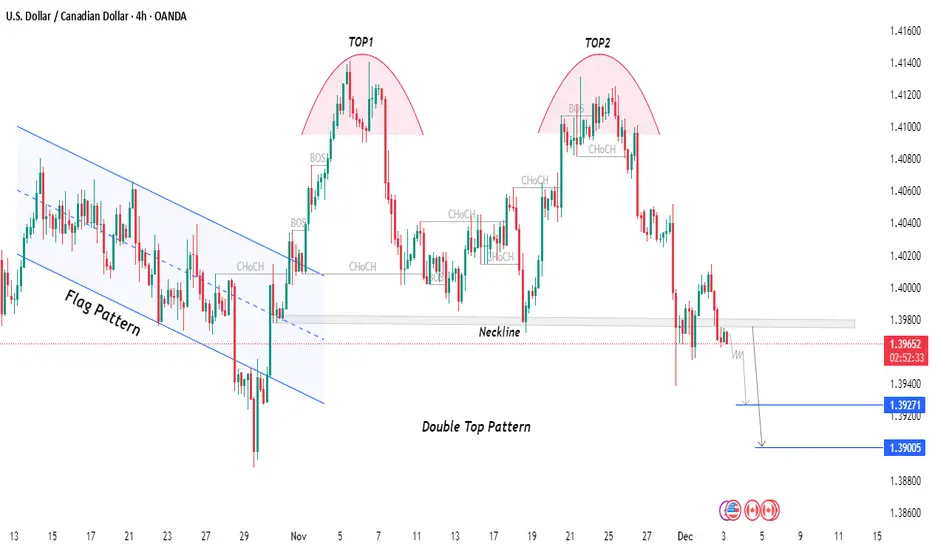
USDCAD has completed a Double Top Pattern after failing to break above the 1.4100 region twice. Price has now broken below the neckline, indicating a potential shift toward a bearish continuation.
Flag Pattern Breakout – Earlier bullish momentum ended after the flag breakout, but the structure later shifted.
Double Top (TOP1 & TOP2) – Clear rejection from the same supply region shows weakening bullish pressure.
Neckline Break – Price has broken the neckline support, which often confirms the double-top reversal.
Market Structure – Multiple CHOCH and BOS signals highlight increasing bearish order flow.
Downside Targets – If bearish pressure continues, next key levels sit near 1.3927 and 1.3900, where liquidity and previous reactions exist.
This analysis is for educational purposes only — always use proper risk management and confirm with your own strategy.
Dagangan aktif
♾️ Join my Telegram // Real Trade ; Real Result // 💱 Gold signal ; Forex signal ; Free signal
t.me/HGFDT5TtUy6Nm7H
t.me/HGFDT5TtUy6Nm7H
Penafian
Maklumat dan penerbitan adalah tidak bertujuan, dan tidak membentuk, nasihat atau cadangan kewangan, pelaburan, dagangan atau jenis lain yang diberikan atau disahkan oleh TradingView. Baca lebih dalam Terma Penggunaan.