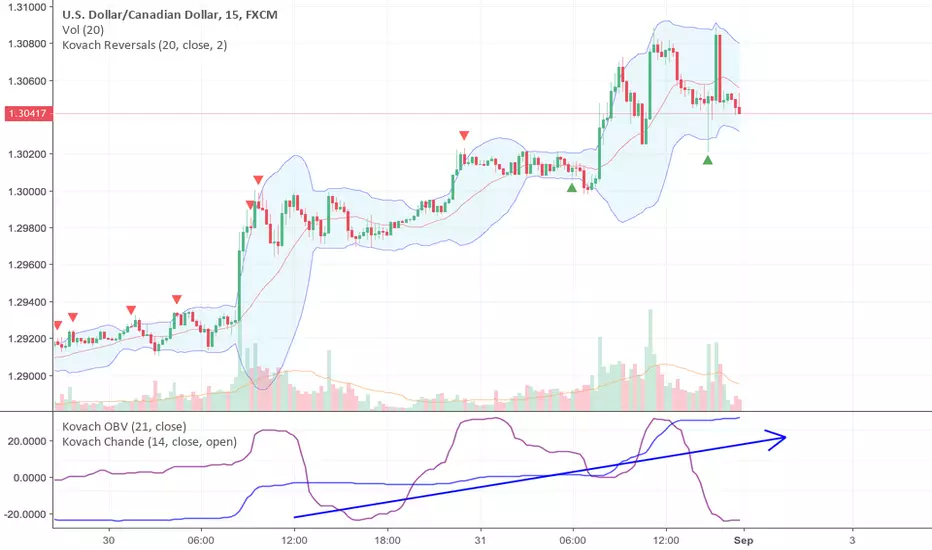
The Kovach Momentum Indicators and Reversals indicator together gave the heads up on a great trade in the Canadian dollar on the back of the trade war on Friday. Those who were paying attention toward the end of the American session (its always thin trading on Fridays), could have made an easy 80 pips.
Observe how the Kovach OBV (blue line) maintains an upward trajectory, but the purple line, the Kovach Chande takes a dip. This is telling us that long term momentum is strong (likely due to insiders) in USDCAD (ie CAD is bearish), but that short term momentum has let up a bit, and thus this is the dip to buy. You never want to chase a trending asset, let you get caught in a pullback, and this set of indicators is perfect for pointing this out. Observe also, the green triangles which identify when you can add to a position.
Observe how the Kovach OBV (blue line) maintains an upward trajectory, but the purple line, the Kovach Chande takes a dip. This is telling us that long term momentum is strong (likely due to insiders) in USDCAD (ie CAD is bearish), but that short term momentum has let up a bit, and thus this is the dip to buy. You never want to chase a trending asset, let you get caught in a pullback, and this set of indicators is perfect for pointing this out. Observe also, the green triangles which identify when you can add to a position.
Join my discord at discord.io/quantguy
Penafian
Maklumat dan penerbitan adalah tidak dimaksudkan untuk menjadi, dan tidak membentuk, nasihat untuk kewangan, pelaburan, perdagangan dan jenis-jenis lain atau cadangan yang dibekalkan atau disahkan oleh TradingView. Baca dengan lebih lanjut di Terma Penggunaan.