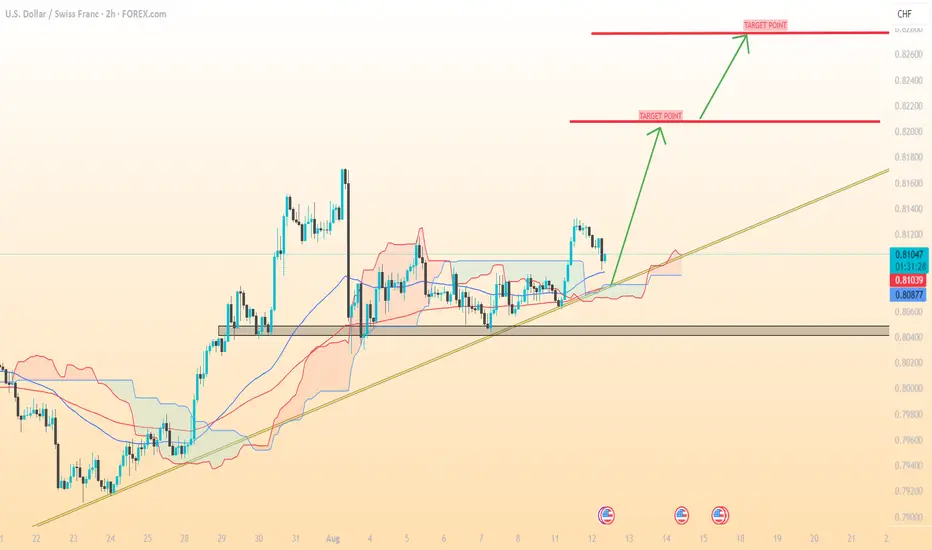
USD/CHF chart (2H),
---
🎯 Targets
First Target: 0.82050 – This is the nearest resistance from recent highs and a likely short-term take-profit zone.
Second Target: 0.82600 – Stronger resistance, aligning with previous rejection and psychological round number.
Extended Target (if breakout continues): 0.82550 – Based on the height of your last consolidation zone projected upward.
---
📊 Indicators in my Chart
1. Ichimoku Cloud
Price is currently above the Kumo (cloud) — bullish signal.
Conversion Line (Tenkan-sen) above Base Line (Kijun-sen) — confirms upside momentum.
Cloud ahead is thin and bullish-colored, suggesting easy upward movement if momentum holds.
2. Trendline Support
Strong ascending trendline from late July — price bouncing off this shows buyers are still in control.
3. Horizontal Support/Resistance
Marked red lines show previous swing highs — your logical target zones.
4. Volume Profile (on left)
Shows high trading activity zone between 0.8100 – 0.8130, meaning once price leaves this area, moves can be faster.
---
🛡 Suggested Stop Loss
Below 0.80800 (just under the cloud and trendline) to avoid false breakouts.
---
🎯 Targets
First Target: 0.82050 – This is the nearest resistance from recent highs and a likely short-term take-profit zone.
Second Target: 0.82600 – Stronger resistance, aligning with previous rejection and psychological round number.
Extended Target (if breakout continues): 0.82550 – Based on the height of your last consolidation zone projected upward.
---
📊 Indicators in my Chart
1. Ichimoku Cloud
Price is currently above the Kumo (cloud) — bullish signal.
Conversion Line (Tenkan-sen) above Base Line (Kijun-sen) — confirms upside momentum.
Cloud ahead is thin and bullish-colored, suggesting easy upward movement if momentum holds.
2. Trendline Support
Strong ascending trendline from late July — price bouncing off this shows buyers are still in control.
3. Horizontal Support/Resistance
Marked red lines show previous swing highs — your logical target zones.
4. Volume Profile (on left)
Shows high trading activity zone between 0.8100 – 0.8130, meaning once price leaves this area, moves can be faster.
---
🛡 Suggested Stop Loss
Below 0.80800 (just under the cloud and trendline) to avoid false breakouts.
Dagangan aktif
trade active📲 Join telegram channel free ..
t.me/RSI_Trading_Point4
Forex, Gold & Crypto Signals with detailed analysis & get consistent results..
t.me/RSI_Trading_Point4
Gold Signal's with proper TP & SL for high profit opportunities..
t.me/RSI_Trading_Point4
Forex, Gold & Crypto Signals with detailed analysis & get consistent results..
t.me/RSI_Trading_Point4
Gold Signal's with proper TP & SL for high profit opportunities..
Penerbitan berkaitan
Penafian
Maklumat dan penerbitan adalah tidak dimaksudkan untuk menjadi, dan tidak membentuk, nasihat untuk kewangan, pelaburan, perdagangan dan jenis-jenis lain atau cadangan yang dibekalkan atau disahkan oleh TradingView. Baca dengan lebih lanjut di Terma Penggunaan.
📲 Join telegram channel free ..
t.me/RSI_Trading_Point4
Forex, Gold & Crypto Signals with detailed analysis & get consistent results..
t.me/RSI_Trading_Point4
Gold Signal's with proper TP & SL for high profit opportunities..
t.me/RSI_Trading_Point4
Forex, Gold & Crypto Signals with detailed analysis & get consistent results..
t.me/RSI_Trading_Point4
Gold Signal's with proper TP & SL for high profit opportunities..
Penerbitan berkaitan
Penafian
Maklumat dan penerbitan adalah tidak dimaksudkan untuk menjadi, dan tidak membentuk, nasihat untuk kewangan, pelaburan, perdagangan dan jenis-jenis lain atau cadangan yang dibekalkan atau disahkan oleh TradingView. Baca dengan lebih lanjut di Terma Penggunaan.