analyzing USD/JPY on the 3H chart.
Looking at my chart:
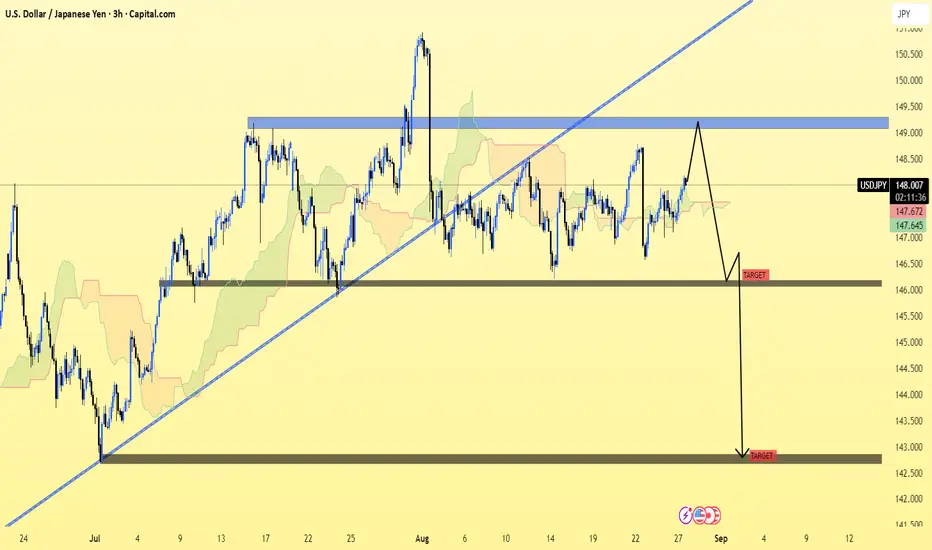
Price is trading around 148.05.
There’s a blue resistance zone near 149.00–149.50 (supply area).
You have drawn two downside targets after potential rejection.
📉 Key Bearish Targets (from your chart)
1. First Target Zone: Around 146.50
→ This is the first strong support area marked.
2. Second / Final Target Zone: Around 142.00–142.20
→ If bearish continuation plays out, this is the larger downside target.
⚠ Trade Notes
A rejection from 149.00 resistance could trigger a fall toward 146.50.
A break below 146.50 support would strengthen bearish momentum, opening the way to 142.00.
On the other hand, if price breaks and holds above 149.50, this bearish scenario is invalidated.
👉 In summary: Target 1 = 146.50, Target 2 = 142.00.
Looking at my chart:
Price is trading around 148.05.
There’s a blue resistance zone near 149.00–149.50 (supply area).
You have drawn two downside targets after potential rejection.
📉 Key Bearish Targets (from your chart)
1. First Target Zone: Around 146.50
→ This is the first strong support area marked.
2. Second / Final Target Zone: Around 142.00–142.20
→ If bearish continuation plays out, this is the larger downside target.
⚠ Trade Notes
A rejection from 149.00 resistance could trigger a fall toward 146.50.
A break below 146.50 support would strengthen bearish momentum, opening the way to 142.00.
On the other hand, if price breaks and holds above 149.50, this bearish scenario is invalidated.
👉 In summary: Target 1 = 146.50, Target 2 = 142.00.
Dagangan aktif
trade active📲 Join telegram channel free ..
t.me/EU_USA_AND_CHAINA_TRADER
Forex, Gold & Crypto Signals with detailed analysis & get consistent results..
Gold Signal's with proper TP & SL for high profit ..
t.me/+GnRTz3YWKk9mZDM8
t.me/EU_USA_AND_CHAINA_TRADER
Forex, Gold & Crypto Signals with detailed analysis & get consistent results..
Gold Signal's with proper TP & SL for high profit ..
t.me/+GnRTz3YWKk9mZDM8
Penerbitan berkaitan
Penafian
Maklumat dan penerbitan adalah tidak dimaksudkan untuk menjadi, dan tidak membentuk, nasihat untuk kewangan, pelaburan, perdagangan dan jenis-jenis lain atau cadangan yang dibekalkan atau disahkan oleh TradingView. Baca dengan lebih lanjut di Terma Penggunaan.
📲 Join telegram channel free ..
t.me/EU_USA_AND_CHAINA_TRADER
Forex, Gold & Crypto Signals with detailed analysis & get consistent results..
Gold Signal's with proper TP & SL for high profit ..
t.me/+GnRTz3YWKk9mZDM8
t.me/EU_USA_AND_CHAINA_TRADER
Forex, Gold & Crypto Signals with detailed analysis & get consistent results..
Gold Signal's with proper TP & SL for high profit ..
t.me/+GnRTz3YWKk9mZDM8
Penerbitan berkaitan
Penafian
Maklumat dan penerbitan adalah tidak dimaksudkan untuk menjadi, dan tidak membentuk, nasihat untuk kewangan, pelaburan, perdagangan dan jenis-jenis lain atau cadangan yang dibekalkan atau disahkan oleh TradingView. Baca dengan lebih lanjut di Terma Penggunaan.