USD/JPY (2H timeframe, FXCM) chart:
Here’s the setup my drawn — and what it suggests:
---
🧭 Chart Summary
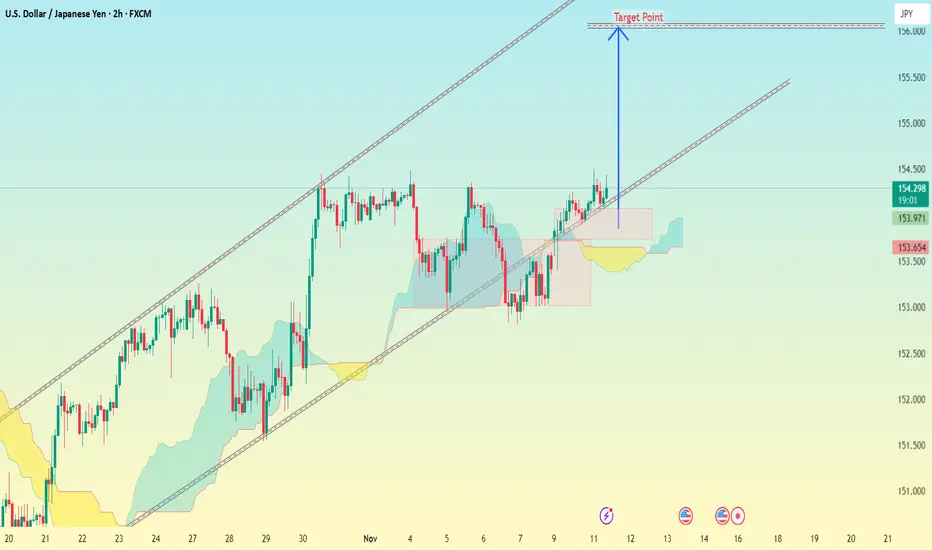
Current Price: Around 154.31
Trend: Uptrend channel (price moving between two parallel rising lines)
Breakout: Price has bounced above the midline and seems to be heading toward the upper boundary
Ichimoku Cloud: Price is above the cloud → confirming bullish momentum
Box (pink): Indicates previous consolidation or retest zone around 153.6–153.9
---
🎯 Target Analysis
From my chart, the blue arrow labeled "Target Point" points toward the upper trendline of the channel.
Target Zone: Around 155.80 – 156.00
(that’s where my upper channel resistance + target point line meet)
---
📈 Summary
Level Type Target Zone
Entry (current) — 154.3
1st Target Main upward target 155.8 – 156.0
Stop-loss (recommended) Below last swing / cloud 153.5 – 153.6
---
⚠ Notes:
As long as price stays above 153.8, bullish continuation looks strong.
If price breaks below 153.5, this bullish setup becomes weak and might turn sideways or bearish.
I can trail stop-loss once price crosses 155.0.
Here’s the setup my drawn — and what it suggests:
---
🧭 Chart Summary
Current Price: Around 154.31
Trend: Uptrend channel (price moving between two parallel rising lines)
Breakout: Price has bounced above the midline and seems to be heading toward the upper boundary
Ichimoku Cloud: Price is above the cloud → confirming bullish momentum
Box (pink): Indicates previous consolidation or retest zone around 153.6–153.9
---
🎯 Target Analysis
From my chart, the blue arrow labeled "Target Point" points toward the upper trendline of the channel.
Target Zone: Around 155.80 – 156.00
(that’s where my upper channel resistance + target point line meet)
---
📈 Summary
Level Type Target Zone
Entry (current) — 154.3
1st Target Main upward target 155.8 – 156.0
Stop-loss (recommended) Below last swing / cloud 153.5 – 153.6
---
⚠ Notes:
As long as price stays above 153.8, bullish continuation looks strong.
If price breaks below 153.5, this bullish setup becomes weak and might turn sideways or bearish.
I can trail stop-loss once price crosses 155.0.
Dagangan aktif
trade active 📲 Join telegram channel free .
t.me/addlist/dg3uSwzkMSplNjFk
Forex, Gold & Crypto Signals with detailed analysis & get consistent results.
t.me/addlist/dg3uSwzkMSplNjFk
Gold Signal's with proper TP & SL for high profit opportunities.
t.me/addlist/dg3uSwzkMSplNjFk
Forex, Gold & Crypto Signals with detailed analysis & get consistent results.
t.me/addlist/dg3uSwzkMSplNjFk
Gold Signal's with proper TP & SL for high profit opportunities.
Penerbitan berkaitan
Penafian
The information and publications are not meant to be, and do not constitute, financial, investment, trading, or other types of advice or recommendations supplied or endorsed by TradingView. Read more in the Terms of Use.
📲 Join telegram channel free .
t.me/addlist/dg3uSwzkMSplNjFk
Forex, Gold & Crypto Signals with detailed analysis & get consistent results.
t.me/addlist/dg3uSwzkMSplNjFk
Gold Signal's with proper TP & SL for high profit opportunities.
t.me/addlist/dg3uSwzkMSplNjFk
Forex, Gold & Crypto Signals with detailed analysis & get consistent results.
t.me/addlist/dg3uSwzkMSplNjFk
Gold Signal's with proper TP & SL for high profit opportunities.
Penerbitan berkaitan
Penafian
The information and publications are not meant to be, and do not constitute, financial, investment, trading, or other types of advice or recommendations supplied or endorsed by TradingView. Read more in the Terms of Use.