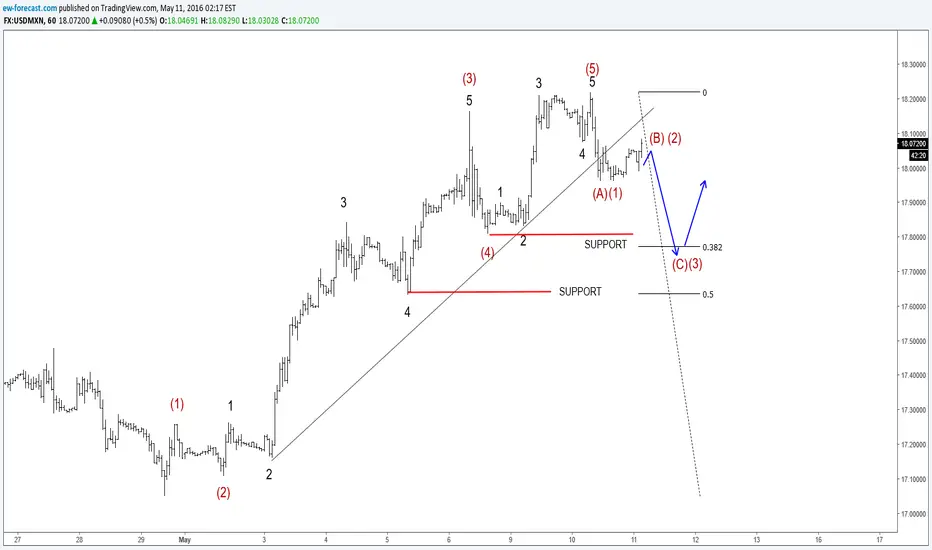
Intraday structure of USDMXN suggest that a temporary top can be in place around 18.218, as price made a nice five wave move to the upside, from recent lows at 17.053. Therefore as we know, after every five wave move a minimum three wave retracement usually follows, as in our case recent broken channel support line could indicate a temporary bearish run, with red wave (A) or (1) already completed. Ideally price will continue towards the level of a formal wave four, where some supports can be found before again turning to the upside.
ew-forecast.com
@ewforecast
ew-forecast.com
@ewforecast
US Single STOCKS (FREE Access), FX, Crypto
👉Explore Our Services @ wavetraders.com/elliott-wave-plans/
Learn Elliott Waves
👉 wavetraders.com/academy/
Newsletter Sign up
👉 bit.ly/3FVPVzO
👉Explore Our Services @ wavetraders.com/elliott-wave-plans/
Learn Elliott Waves
👉 wavetraders.com/academy/
Newsletter Sign up
👉 bit.ly/3FVPVzO
Penafian
Maklumat dan penerbitan adalah tidak dimaksudkan untuk menjadi, dan tidak membentuk, nasihat untuk kewangan, pelaburan, perdagangan dan jenis-jenis lain atau cadangan yang dibekalkan atau disahkan oleh TradingView. Baca dengan lebih lanjut di Terma Penggunaan.
