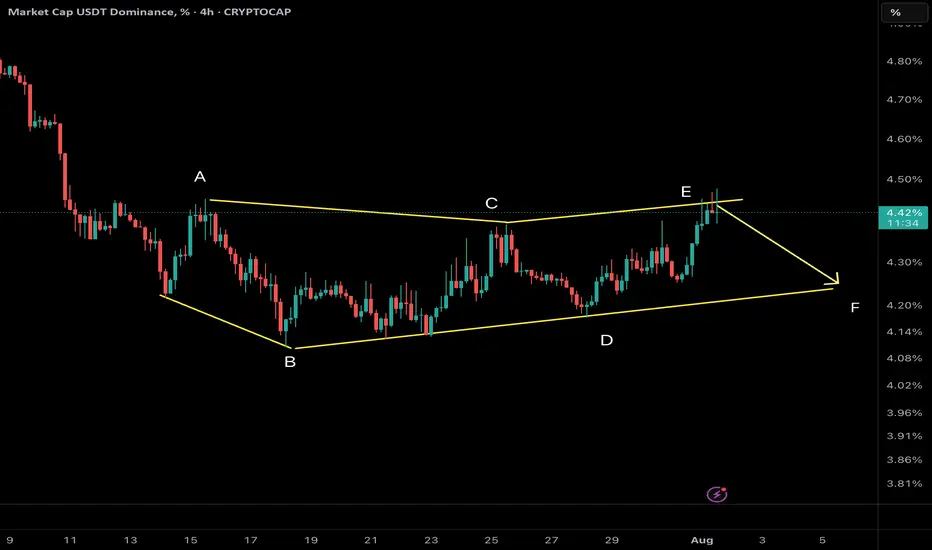
We are tracking a NeoWave Diametric formation (7-leg corrective structure: A–B–C–D–E–F–G) on the USDT Dominance chart. Recently, price reached the projected resistance zone of wave E, and early signs of reversal are emerging.
⸻
🧠 Structural Analysis:
• The structure has developed with alternating legs in price and time, consistent with the symmetrical diametric rules.
• Wave E has likely completed, reacting from prior supply and resistance.
• A pullback from here can mark the beginning of Wave F, which in diametrics tends to retrace significantly toward the internal balance of the structure.
⸻
🔍 What to Watch:
• Confirmation of bearish intent via a break of internal supports or lower-timeframe BOS.
• Possible retracement targets: 4.2% → 3.95%, depending on momentum.
• A decisive break below 4.00% would reinforce the wave F scenario.
⸻
⚠️ Implications for the Crypto Market:
A drop in USDT Dominance typically indicates rotation into risk assets (alts/BTC/ETH). However, context matters — if the drop happens during a general market sell-off, it may reflect risk-off unwinding into fiat, not risk-on rotation.
⸻
🔄 Strategy Note:
• Avoid premature shorts or longs; wait for structure to confirm.
• Watch for smart money traps (e.g., false breakouts or liquidity grabs) around the recent highs.
⸻
📌 This is a high-risk zone for entering long USDT.D — be cautious with stablecoin bias.
📊 Analysis by CryptoPilot – Precision through structure.
📊 CryptoPilot – Advanced Technical Analysis for BTC & Altcoins
🔎 Smart Money • Price Action • NeoWave • Multi-Timeframe Context
📩 Contact: @CryptoPilot_1 (Telegram)
📥 Telegram Chanell : @CryptoPilot_Trading
🔎 Smart Money • Price Action • NeoWave • Multi-Timeframe Context
📩 Contact: @CryptoPilot_1 (Telegram)
📥 Telegram Chanell : @CryptoPilot_Trading
Penerbitan berkaitan
Penafian
Maklumat dan penerbitan adalah tidak bertujuan, dan tidak membentuk, nasihat atau cadangan kewangan, pelaburan, dagangan atau jenis lain yang diberikan atau disahkan oleh TradingView. Baca lebih dalam Terma Penggunaan.