Could OIL Slide to $60? a 5% Drop Might Be on the Table?
Hey Realistic Traders!
Price action is weakening. Will USOIL find support or slide further?
Let’s Break It Down..
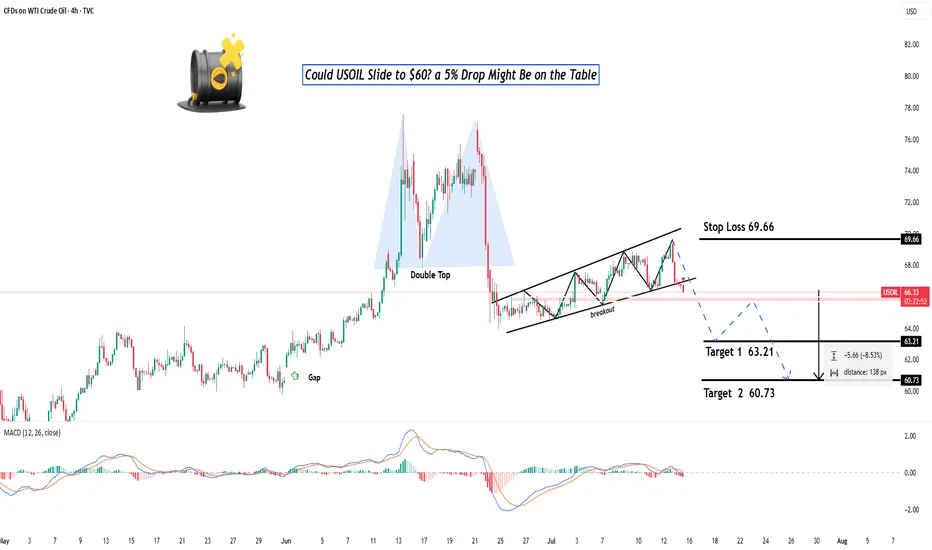
On the 4H timeframe, oil has formed a double top pattern followed by a neckline breakout, which is a classic sign of a potential shift from a bullish to a bearish trend.
This breakout was confirmed by a break below the bullish trendline, accompanied by consecutive bearish full-body candlesticks that reinforce the bearish momentum. Afterward, the price formed a bearish continuation pattern known as a rising wedge, which was followed by a breakdown.
The combination of bearish reversal and continuation pattern breakouts signals further downside movement and confirms the shift into a bearish trend.
Therefore, we foresee the price forming lower lows and lower highs toward the first target at 63.21, with a potential extension to the close the gap at 60.73.
The bearish outlook remains valid as long as the price stays below the key stop-loss level at 69.66.
Support the channel by engaging with the content, using the rocket button, and sharing your opinions in the comments below.
Disclaimer: This analysis is for educational purposes only and should not be considered a recommendation to take a long or short position on USOIL.
Price action is weakening. Will USOIL find support or slide further?
Let’s Break It Down..
On the 4H timeframe, oil has formed a double top pattern followed by a neckline breakout, which is a classic sign of a potential shift from a bullish to a bearish trend.
This breakout was confirmed by a break below the bullish trendline, accompanied by consecutive bearish full-body candlesticks that reinforce the bearish momentum. Afterward, the price formed a bearish continuation pattern known as a rising wedge, which was followed by a breakdown.
The combination of bearish reversal and continuation pattern breakouts signals further downside movement and confirms the shift into a bearish trend.
Therefore, we foresee the price forming lower lows and lower highs toward the first target at 63.21, with a potential extension to the close the gap at 60.73.
The bearish outlook remains valid as long as the price stays below the key stop-loss level at 69.66.
Support the channel by engaging with the content, using the rocket button, and sharing your opinions in the comments below.
Disclaimer: This analysis is for educational purposes only and should not be considered a recommendation to take a long or short position on USOIL.
Dagangan aktif
I still has conviction on the positionCandlestick formation formed a base, right below the lower trendline of the structure
Usually indicate a potential continuation of the bearish trend
Penerbitan berkaitan
Penafian
Maklumat dan penerbitan adalah tidak dimaksudkan untuk menjadi, dan tidak membentuk, nasihat untuk kewangan, pelaburan, perdagangan dan jenis-jenis lain atau cadangan yang dibekalkan atau disahkan oleh TradingView. Baca dengan lebih lanjut di Terma Penggunaan.
Penerbitan berkaitan
Penafian
Maklumat dan penerbitan adalah tidak dimaksudkan untuk menjadi, dan tidak membentuk, nasihat untuk kewangan, pelaburan, perdagangan dan jenis-jenis lain atau cadangan yang dibekalkan atau disahkan oleh TradingView. Baca dengan lebih lanjut di Terma Penggunaan.