There has been a lot of demand for oil analysis.
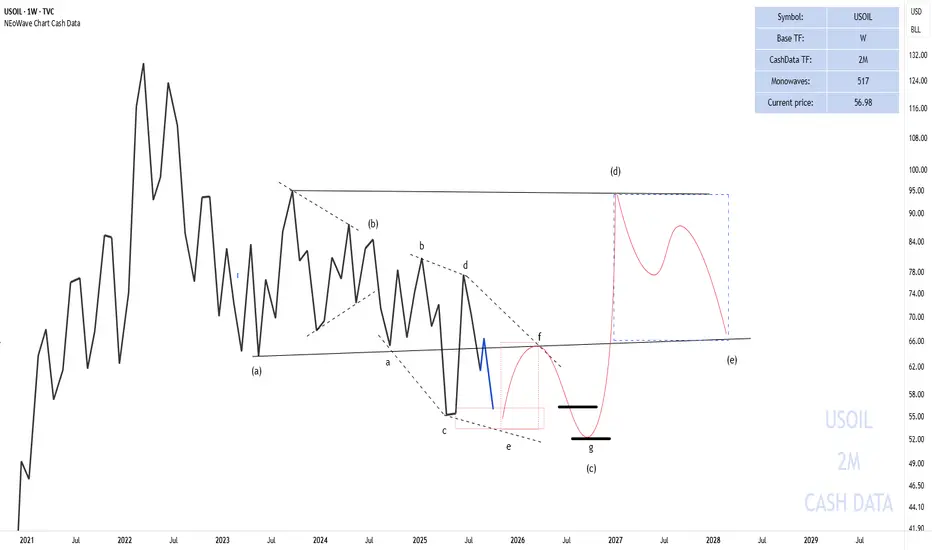
In the 2-month cash data, we see that oil reached $56, and many say there’s a possibility that oil may not touch the high levels above $70 again, but the chart suggests otherwise.
In the 2-month cash data, given the complexity in wave-(c), it appears that a reverse contracting triangle pattern is forming. After the completion of wave-(c), wave-(d) of this triangle could potentially rise to $90.
Currently, we are in wave-(c) of this triangle, which is transforming into a diamond diametric pattern. Wave g of this diametric could end at $56 or in the $50-52 range, completing wave-(c).
The chart will be updated if needed.
Good luck
NEoWave Chart
Penafian
Maklumat dan penerbitan adalah tidak dimaksudkan untuk menjadi, dan tidak membentuk, nasihat untuk kewangan, pelaburan, perdagangan dan jenis-jenis lain atau cadangan yang dibekalkan atau disahkan oleh TradingView. Baca dengan lebih lanjut di Terma Penggunaan.
Penafian
Maklumat dan penerbitan adalah tidak dimaksudkan untuk menjadi, dan tidak membentuk, nasihat untuk kewangan, pelaburan, perdagangan dan jenis-jenis lain atau cadangan yang dibekalkan atau disahkan oleh TradingView. Baca dengan lebih lanjut di Terma Penggunaan.